Free - Use History Of Measurement Timeline PPT Presentation

Free
Timeline slide with four colored circles with years 2017 to 2020, each connected by a line and text fields.
P.ID : 40786
    357 views
    107 Downloads
    Get Custom Slides by Experts
    Enhance Your Presentations with Add-ins
    Google Slides Add-in
    Access templates directly in Google Slides
    Microsoft PowerPoint Add-in
    Access templates directly in PowerPoint
    GPT Add-on
    AI-powered presentation assistance

    Exclusive History Timeline PPT Template

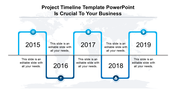
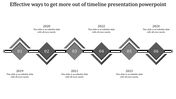
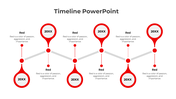
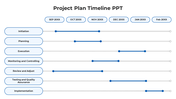
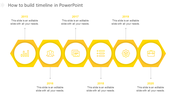
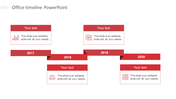
    History of measurement timeline ppt template that shows the timeline based on years. The template is mainly used for business meetings to show their performance during the previous years.

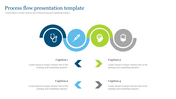
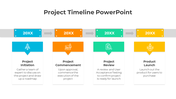
    The template is given with linear flow nodes where each node is colored with vibrant colors. The nodes are indicated with dots that the audience can easily understand.

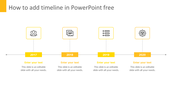
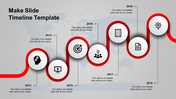
    The template is exclusive with years and dates on the nodes. Since this template is fully customized, is it easier to edit? This user-friendly template can make your presentation a vibe among the audience as it can be modified and added with information as per the user's wish.

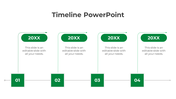
    The template can make your audience understand the topic clearly. Make sure to download this explicit template and gain the attention of the audience. Grab now!.

    Features of this template:

    1. 100% customizable slides and easy to download.
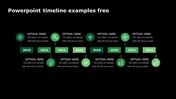
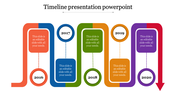
    2. Slides available in different nodes & colors.
    3. The slide contained 16:9 and 4:3 format.
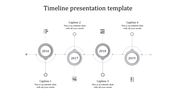
    4. Easy to change the slide colors quickly.
    5. Well-crafted template with instant download facility.

    Advertisement

    You May Also Like These PowerPoint Templates

    Add to Wishlist
    Download
    AI Customize
    Timeline with circular year markers and icons in pink, blue, green, yellow, red, and purple, showing years from 2015 to 2020.
    Add to Wishlist
    Download
    AI Customize
    Horizontal red arrow timeline showing years 2009 to 2019 in sequence with gradient shades in a grey backdrop.
    Free
    Add to Wishlist
    Download
    AI Customize
    Horizontal timeline years 2017 to 2020, with orange arrows containing icons like a document, and graph, each followed by text.
    Free
    Add to Wishlist
    Download
    AI Customize
    Gray timeline infographic displaying years 2014 to 2018, with captions placed above and below the horizontal chain.
    Free
    Add to Wishlist
    Download
    AI Customize
    Horizontal timeline featuring five red teardrop shaped markers for 2017-2021, each connected to a caption below.
    Free
    Add to Wishlist
    Download
    AI Customize
    Horizontal purple timeline spanning 2017-2020 with alternating text boxes positioned above and below the timeline.
    Add to Wishlist
    Download
    AI Customize
    History design slide with a wavy arrowed path connecting icons for research and growth across five years.
    Add to Wishlist
    Download
    AI Customize
    Vertical timeline with circular icons blue, green, yellow, and purpe, representing months, connected by dotted lines.
    Add to Wishlist
    Download
    AI Customize
    Unique selling proposition diagram with five 3D ovals in different colors, each highlighting key marketing attributes.
    Add to Wishlist
    Download
    AI Customize
    Guerrilla marketing steps with four hexagons, highlighting tasks from market research up to building a marketing mix.
    Add to Wishlist
    Download
    AI Customize
    Editable Business Icons For Presentations Template
    Free
    Add to Wishlist
    Download
    AI Customize
    Red timeline with triangular markers for years 2017 to 2021, featuring icons like a briefcase, gears, and a paper plane.
    Add to Wishlist
    Download
    AI Customize
    Isometric timeline with six raised diamond blocks in red, pink, green, orange, and purple, displaying years 2017-2022
    Add to Wishlist
    Download
    AI Customize
    Creative Timeline And Milestones Template PowerPoint
    Add to Wishlist
    Download
    AI Customize
    Marketing infographic with five connected circular segments labeled Business, Process, Target, Growth, and Profit.
    Add to Wishlist
    Download
    AI Customize
    Business concept diagram with four colorful circular icons and matching speech bubble text boxes connected in a flow layout.
    Add to Wishlist
    Download
    AI Customize
    Five element revenue model diagram with icons in yellow, orange, red, pink, and blue, each linked to descriptive text.
    Free
    Add to Wishlist
    Download
    AI Customize
    Symmetrical slide showing four red caption between left and right icons, with connecting dots and a central vertical divider.
    Free
    Add to Wishlist
    Download
    AI Customize
    Six hexagonal icons in green, showcasing different aspects of a marketing strategy, connected in a linear layout.