Red Growth PPT Template and Google Slides Themes

Bar stages growth slide with three columns in a 3D style, showing different heights for percentage value with caption areas.
P.ID : 20140
    158 views
    11 Downloads
    Get Custom Slides by Experts
    Instantly Access Templates in PowerPoint

    Red Growth PPT Template and Google Slides Themes


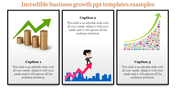
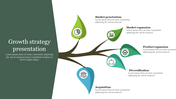
    Showcase your growth analysis with our sleek PowerPoint template and Google Slides design. Featuring three bars filled with vibrant red color, each topped with a gray cap, this template visually represents growth metrics and progress. Set against a clean white background, the red bars stand out prominently, ensuring your data is easily understood and impactful. 

    Whether you're presenting financial growth, market expansion, or project progress, this template offers a clear and compelling way to convey your growth analysis. Engage your audience and highlight your achievements with this dynamic and professional template.

    Features of the template


    • 100% customizable slides and easy to download.
    • Slides are available in different nodes & colors.
    • The slide contains 16:9 and 4:3 formats.
    • It is easy to change the colors of the slide quickly. 
    • Well-crafted template with an instant download facility.
    Advertisement

    You May Also Like These PowerPoint Templates

    Add to Wishlist
    Download
    AI Customize
    Slide showing marketing steps growth, general marketing, and online marketing with relevant icons and descriptive captions.
    Free
    Add to Wishlist
    Download
    AI Customize
    Business growth slide with a 3D bar chart in multiple colors, trend lines, and descriptive text on the right side.
    Add to Wishlist
    Download
    AI Customize
    PowerPoint slide showcasing company growth with a pyramid model and levels of success marked from 1 to 4.
    Free
    Add to Wishlist
    Download
    AI Customize
    Create Business Growth Presentation PPT Slide Templates
    Add to Wishlist
    Download
    AI Customize
    Colorful staircase infographic with six steps leading to a yellow arrow, each featuring icons and descriptions.
    Add to Wishlist
    Download
    AI Customize
    3D pyramid style target with five colorful ascending layers numbered 01 to 05, labeled with placeholder text areas.
    Add to Wishlist
    Download
    AI Customize
    Growth infographic with four mountain peaks labeled 01 to 04, each featuring captions and gradient color variations.
    Add to Wishlist
    Download
    AI Customize
    A businessman riding a scooter up a red arrow, with three colored text boxes on the left and four captions on the right.
    Add to Wishlist
    Download
    AI Customize
    Tree shaped design in a PowerPoint template with green leaves and roots, representing growth with captions.
    Free
    Add to Wishlist
    Download
    AI Customize
    Innovative Business Growth Strategies PPT Templates
    Add to Wishlist
    Download
    AI Customize
    A tree illustration with prominent numbered leaves from 01 to 04, paired with corresponding text sections on the right.
    Free
    Add to Wishlist
    Download
    AI Customize
    Growth PowerPoint template showcasing triangular peaks labeled with percentages and captions for business data visualization.
    Add to Wishlist
    Download
    AI Customize
    Slide with a rising arrow path featuring five circular milestones in green, red, yellow, blue, and orange, with icons.
    Add to Wishlist
    Download
    AI Customize
    Slide showing a green plant stem with numbered leaves 01 to 04, each paired with captions on both sides.
    Free
    Add to Wishlist
    Download
    AI Customize
    Business strategy infographic with a 3D segmented arrow chart in purple, showing growth tactics and percentages.
    Free
    Add to Wishlist
    Download
    AI Customize
    Tree infographic with green leaves surrounded by eight labeled captions arranged in a circular layout.
    Add to Wishlist
    Download
    AI Customize
    Four 3D columns labeled 01 to 04 representing growth stages, with icons above them and captions on the right.
    Free
    Add to Wishlist
    Download
    AI Customize
    Multicolor cylindrical bar chart with percentages from 60% to 90% for years 2018 to 2021, with a businesswoman illustration.