Best Infographic PowerPoint Presentation And Google Slides
Nodes

Colors




Best Infographic PowerPoint Presentation and Google Slides
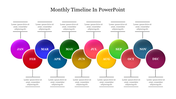
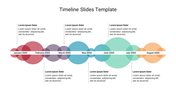
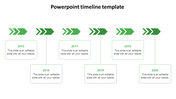
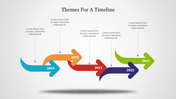
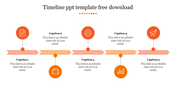
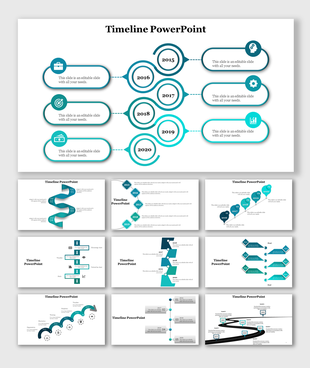
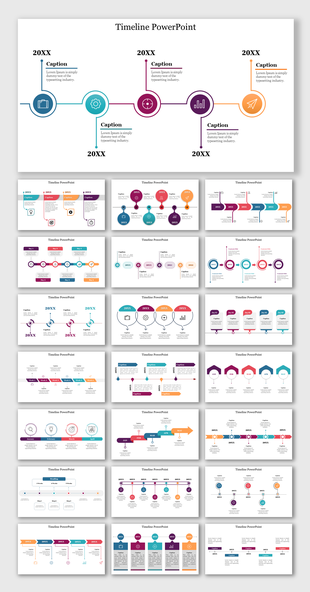
The Infographics PowerPoint presentation template and Google Slides theme feature a dynamic design where five stems of different colors connect one by one, culminating in a sphere at the end. Each stem is accompanied by a text box, allowing presenters to provide information or key points associated with each section of the infographic. The sphere at the end represents the culmination or completion of the journey depicted by the stems.
With its clean and modern design, the template captures audience attention and enhances comprehension of the information being presented. It offers a versatile platform suitable for various purposes such as business reports, project updates, educational presentations, or data visualization.
Fully customizable, users can adjust colors, fonts, and layout elements to align with their branding and presentation style. Whether used for internal meetings, client presentations, or academic seminars, the Infographics PowerPoint presentation template and Google Slides theme provide an impactful tool for communicating ideas effectively.
Features of the template
- 100% customizable slides and easy to download.
- Slides are available in different nodes & colors.
- The slide contains 16:9 and 4:3 formats.
- It is easy to change the colors of the slide quickly.
- Well-crafted template with an instant download facility.
More Collections for Best Infographic PowerPoint Presentation
Recommended based on this template.
Similar Templates to Best Infographic PowerPoint Presentation
Showing20 of69,218 templates