Cycle Chart PowerPoint Presentation And Google Slides Themes

Pack of 21 slides
P.ID : 69885
Advertisement
1.7K+ views
362 Downloads
Get Custom Slides by Experts
Instantly Access Templates in PowerPoint

Creative Cycle Chart Google Slides

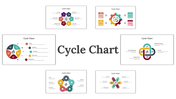
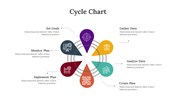
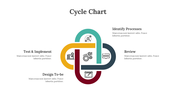
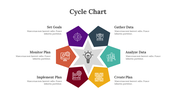
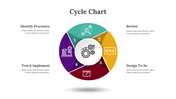
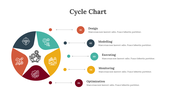
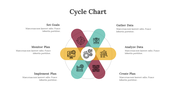
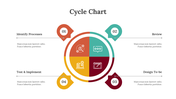
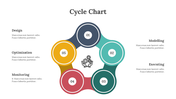
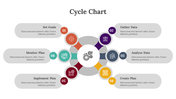
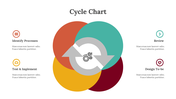
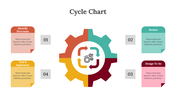
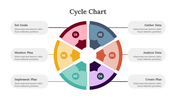
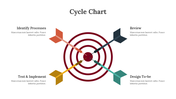
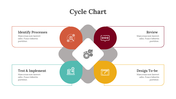
Circular charts are cool designs to represent your data in a cyclic process. Unlike common charts and linear charts, this cyclic diagram has a special feature to explain the process with each stage and make the process get back to the cycle’s beginning. Another interesting thing about this diagram is that it is easy to break down the processes and connect them. This is a simple tool to explain complex topics or concepts like a breeze. Try it and make your ideas shine. Customization is free to do. 

Features of the template

  • 100% customizable slides and easy to download.
  • Slides are available in different nodes & colors.
  • The slides contain 16:9 and 4:3 formats.
  • Easy to change the colors quickly.
  • It is a well-crafted template with an instant download facility.
  • It is a 100% pre-designed slide.
  • This slide is compatible with Google Slide Themes.
  • This pack of 21 slides in a single deck.

You May Also Like These PowerPoint Templates

Add to Wishlist
Download
AI Customize
PowerPoint slide illustrating customer touch points, featuring a flowchart of six stages from commitment to loyalty.
Add to Wishlist
Download
AI Customize
Transition slide displaying five tracks with check marks, illustrating progress in a linear format.
Add to Wishlist
Download
AI Customize
Illustration of the butterfly life cycle showing stages from caterpillar, to adult butterfly on a floral background.
Add to Wishlist
Download
AI Customize
Colorful pie chart with eight numbered sections representing business buying steps, with labels around it.
Add to Wishlist
Download
AI Customize
Effective Operations Management PPT  & Google Slides
Add to Wishlist
Download
AI Customize
Five interconnected circles with arrows showing from enterprise purpose up to management system each with a caption area.
Add to Wishlist
Download
AI Customize
Diagram illustrating the supply chain optimization process, highlighting key stages.
Add to Wishlist
Download
AI Customize
Slide with blue to green gradient wave shaped infographic with five sections numbered 01 to 05, each with icon and text.
Add to Wishlist
Download
AI Customize
Flowchart with colorful icons, illustrating key stages of grounded theory research along a vertical arrow.
Add to Wishlist
Download
AI Customize
Customer types slide showing categories decision maker, economic buyer, recommender, influencer, and end user.
Add to Wishlist
Download
AI Customize
Five step value chart with red, orange, yellow, green, and teal boxes, depicting value and delay in each stage.
Add to Wishlist
Download
AI Customize
Circular chart with eight segments, each labeled with different emotions, and caption areas arranged in a wheel pattern.
Add to Wishlist
Download
AI Customize
A sequence of five diamond shaped icons with corresponding colored text boxes, forming a linear diagram.
Add to Wishlist
Download
AI Customize
Infographic of five colored connected circular steps in a horizontal line, displaying numbered steps with captions below.
Free
Add to Wishlist
Download
AI Customize
Supply chain slide deck featuring icons and diagrams showing the flow of goods from suppliers to shoppers.
Add to Wishlist
Download
AI Customize
A colorful test case slide with four stages from test strategy to delivery each accompanied with placeholder text.
Add to Wishlist
Download
AI Customize
A medical themed slide featuring four steps, each represented by icons and a blue color scheme.
Add to Wishlist
Download
AI Customize
Flywheel diagram template with a central icon and multiple slides segments in various colors with different layouts.
Add to Wishlist
Download
AI Customize
A colorful snake diagram with five segments, each numbered and labeled from 01 to 05, moving in a wavy pattern with captions.
Add to Wishlist
Download
AI Customize
Colorful knowledge management lifecycle slide featuring key stages like knowledge creation and sharing with placeholder text.
Add to Wishlist
Download
AI Customize
Set of slides showing gray arrow flows, circular diagrams in blue, orange, red, and structured process charts.
Add to Wishlist
Download
AI Customize
Five step circular flow diagram with colorful arrows numbered 01 to 05, surrounded by captions on a white background.
Add to Wishlist
Download
AI Customize
Use This Process Of IPO PowerPoint And Google Slides
Add to Wishlist
Download
AI Customize
Five-tiered colorful graphic stacked one above, each labelled with number and paired with text on the right.
Add to Wishlist
Download
AI Customize
ADDIE Model slides detailing the instructional design process with different colorful layout designs.
Add to Wishlist
Download
AI Customize
End user computing slide showcasing a circular flow with five components with placeholder text.
Add to Wishlist
Download
AI Customize
Slide showcasing an escalation process with colorful diamond shaped icons representing various roles with text area.
Add to Wishlist
Download
AI Customize
Five colored circular arrows in a row, each with an icon inside, from pink to red, and descriptions below.
Add to Wishlist
Download
AI Customize
Four Node Serpentine Horizontal Process PPT Slide
Add to Wishlist
Download
AI Customize
Visual flowchart of a sample presentation, showcasing five distinct captions in a vibrant colored design.
Add to Wishlist
Download
AI Customize
Infographic depicting the stages of an IPO process in a circular format, with icons and stack of coins and an arrow.