Customer Profitability Analysis Google Slides Template

Customer Profitability Analysis Google Slides Template
P.ID : 70762
    144 views
    19 Downloads
    Get Custom Slides by Experts
    Instantly Access Templates in PowerPoint

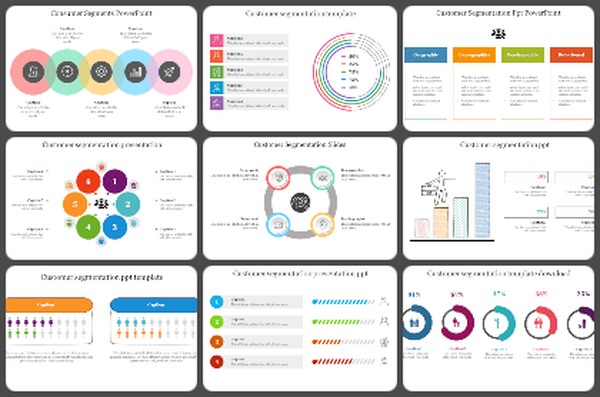
    Customer Profitability Analysis Presentation Slide


    The power of Customer Profitability Analysis is pivotal for businesses today. This strategic tool dives deep into individual customer financials, unveiling their real impact on a company's profitability. By dissecting revenue, costs, and key metrics, organizations gain invaluable insights into their profit sources. Armed with this knowledge, companies can make data-driven decisions, allocate resources efficiently, refine marketing strategies effectively, and enhance customer relationships for long-term profitability. Professionals, analysts, educators, and students from various sectors can harness the potential of this template. Our template offers a visually compelling and structured approach to present the crucial concept of Customer Profitability Analysis. With its user-friendly design and customizable elements, it streamlines the communication of your ideas, making it easier for your audience to grasp and retain. Our Customer Profitability Analysis template features easily editable slides with engaging visuals and adaptable content. Elevate your presentations to a professional standard, ensuring your message is both informative and engaging. Empower your business or educational presentations with this template, and watch your insights resonate effortlessly with your audience.

    Features of the template:


    • 100% customizable slides and easy to download.
    • Slides are available in different nodes & colors.
    • The slide contained 16:9 and 4:3 formats.
    • Easy to change the slide colors quickly.
    • It is a well-crafted template with an instant download facility.
    Advertisement

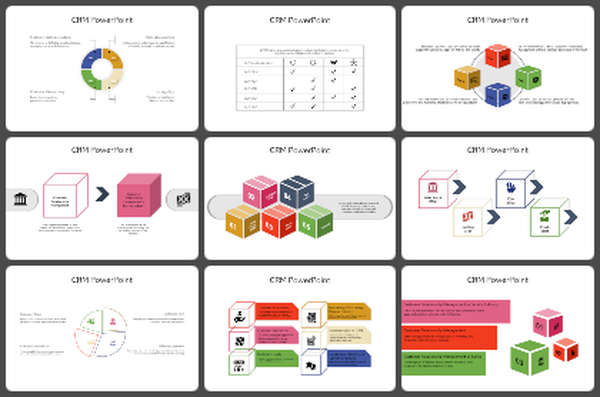
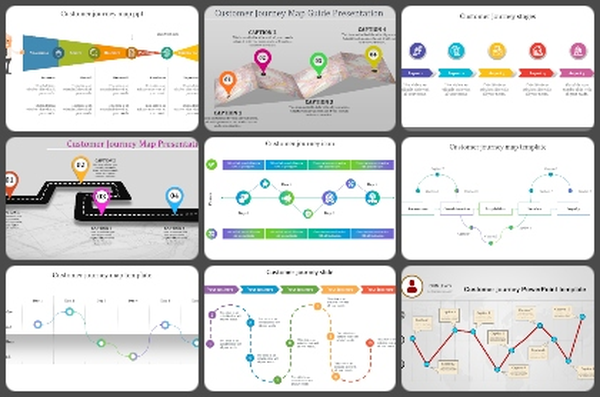
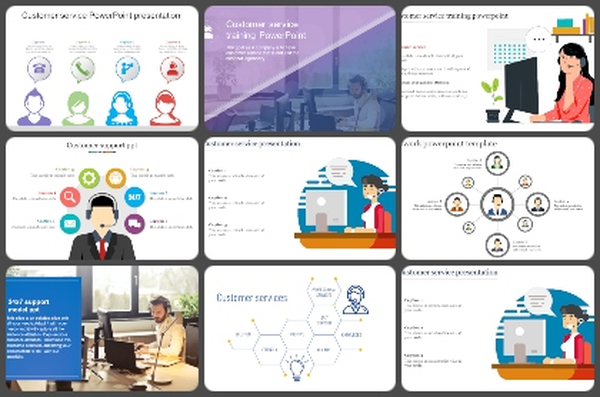
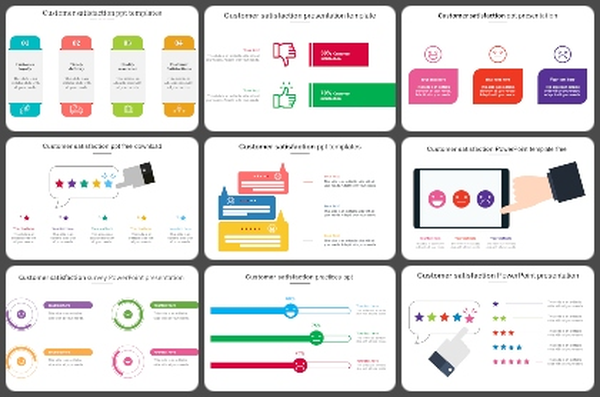
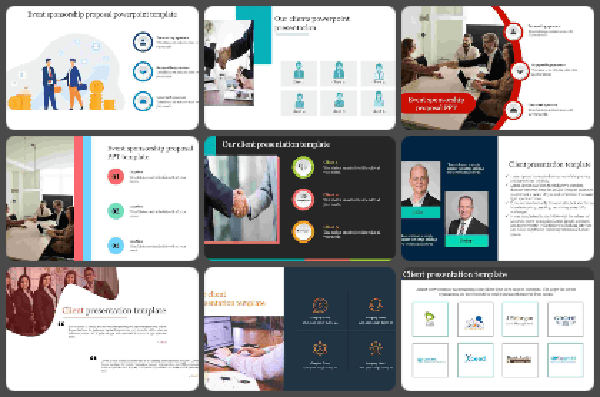
    You May Also Like These PowerPoint Templates

    Add to Wishlist
    Download
    AI Customize
    Customer analysis slides featuring various layout designs illustrating key components with icons.
    Add to Wishlist
    Download
    AI Customize
    Diamond center icon with four surrounding colored petals in orange, red, blue, and purple, for B2B strategy sections.
    Add to Wishlist
    Download
    AI Customize
    Infographic showing customer engagement with icons for surveys, campaigns, forums, and loyalty offers.
    Free
    Add to Wishlist
    Download
    AI Customize
    Slide deck on customer loyalty programs featuring colorful shapes representing various strategies like points systems.
    Add to Wishlist
    Download
    AI Customize
    Customer development slide showcasing stages like discovery, validation, creation, and building with corresponding icons.
    Add to Wishlist
    Download
    AI Customize
    Illustrated person with raised arm surrounded by six colored circular icons, connected by dotted lines.
    Free
    Add to Wishlist
    Download
    AI Customize
    Illustration of two people discussing customer validation with checklist surrounded by circular icons for various tasks.
    Add to Wishlist
    Download
    AI Customize
    Five funnel visual for customer acquisition,  from planning to sales, represented in various colours with caption areas.
    Add to Wishlist
    Download
    AI Customize
    Customer Profitability Analysis PPT And Google Slides
    Add to Wishlist
    Download
    AI Customize
    Multicolored circular design with six numbered segments, each linked to icons on the outer ring, and captions on sides.
    Add to Wishlist
    Download
    AI Customize
    Three rectangular blocks in purple, green, and orange with arrows pointing right, representing need, wants, and demand.
    Add to Wishlist
    Download
    AI Customize
    Four circular sections in green, purple, teal, and blue are connected in a semi circle around a central icon of a person.
    Add to Wishlist
    Download
    AI Customize
    Four key aspects of customer retention from overall satisfaction to advocacy, are represented with color coded icons.
    Add to Wishlist
    Download
    AI Customize
    A diagram illustrating the Delta Model slides showcasing a colorful triangular structure with elements.
    Add to Wishlist
    Download
    AI Customize
    Four labeled icons in green, red, blue, and purple represent elements of a direct to consumer strategy.
    Add to Wishlist
    Download
    AI Customize
    Customer lifetime value infographic with five colored sections surrounding a central circle, representing customer revenue.