Circle Infographic PowerPoint And Google Slides Template

Four-part circle diagram with sections in orange, blue, red, and yellow, illustrating growth, business, target, and process.
P.ID : 161
    4.7K+ views
    510 Downloads
    Get Custom Slides by Experts
    Instantly Access Templates in PowerPoint

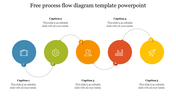
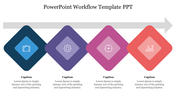
    Best Circle Infographic PPT Slide

    Download this creative flowchart model Circle Infographic PowerPoint Template to make an eye-getting infographic presentation on a technology theme. It is a professional-looking slide that will help you in presenting your information in a visually striking manner. It is also easy to edit according to your presentation theme.

    About the template

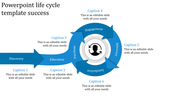
    The Circle Infographic PowerPoint Template has five multicolor hexagons with icons that are connected with an elegant white hexagon. The creative designs of this slide will give a unique look to your presentation. It clearly shows the flow of technology development. It provides you the built-in features to modify the nodes and colors to complement your theme. Find more circle diagrams infographics templates from SlideEgg!

    Features of the template

    • 100% customizable slides and easy to download.
    • Slides are available in different nodes & colors.
    • The slide contained 16:9 and 4:3 formats.
    • Easy to change the slide colors quickly.
    • Well-crafted template with instant download facility.
    • Professional-looking slide.
    Advertisement

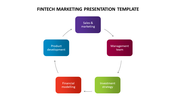
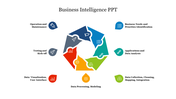
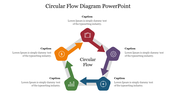
    You May Also Like These PowerPoint Templates

    Add to Wishlist
    Download
    AI Customize
    Premade PowerPoint Templates Presentation & Google Slides
    Add to Wishlist
    Download
    AI Customize
    A slide showing a colorful five-step design process with captions and icons representing different stages.
    Add to Wishlist
    Download
    AI Customize
    Hierarchy diagram with blue boxes and numbered circular nodes, illustrating joint venture types and subcategories.
    Add to Wishlist
    Download
    AI Customize
    Operations management slide illustrating five key elements with colorful interconnected icons with placeholder text.
    Add to Wishlist
    Download
    AI Customize
    Colorful flowchart showing interconnected boxes representing the Burke Litwin model, connected by arrows.
    Add to Wishlist
    Download
    AI Customize
    Circular flywheel diagram with four colored sections in orange, green, purple, and yellow, centered around customer icon.
    Free
    Add to Wishlist
    Download
    AI Customize
    Colorful phased approach slide showing five phases from initiation to closing, with process steps below.
    Add to Wishlist
    Download
    AI Customize
    Five colored square boxes, each with number and captions, linked by a dashed line.
    Free
    Add to Wishlist
    Download
    AI Customize
    Four rectangular shapes in blue outline with icons in curved arrows above and captions below.
    Add to Wishlist
    Download
    AI Customize
    A slide layout displaying essential elements for managing entity level controls, highlighted by vibrant colored icons.
    Add to Wishlist
    Download
    AI Customize
    Slide deck showcasing various process infographics in vibrant layouts, including flow charts and hexagonal designs.
    Add to Wishlist
    Download
    AI Customize
    Diagram illustrating a framework of grounded theory in four steps, with arrows connecting analysis processes and factors.
    Add to Wishlist
    Download
    AI Customize
    PowerPoint slide illustrating customer touch points, featuring a flowchart of six stages from commitment to loyalty.
    Add to Wishlist
    Download
    AI Customize
    Transition slide displaying five tracks with check marks, illustrating progress in a linear format.
    Add to Wishlist
    Download
    AI Customize
    Illustration of the butterfly life cycle showing stages from caterpillar, to adult butterfly on a floral background.
    Add to Wishlist
    Download
    AI Customize
    Colorful pie chart with eight numbered sections representing business buying steps, with labels around it.
    Add to Wishlist
    Download
    AI Customize
    Effective Operations Management PPT  & Google Slides
    Add to Wishlist
    Download
    AI Customize
    Five interconnected circles with arrows showing from enterprise purpose up to management system each with a caption area.
    Add to Wishlist
    Download
    AI Customize
    Diagram illustrating the supply chain optimization process, highlighting key stages.
    Add to Wishlist
    Download
    AI Customize
    Slide with blue to green gradient wave shaped infographic with five sections numbered 01 to 05, each with icon and text.