Introduction
When a business wants to improve, the first question to ask is: “Where are we now, and where do we want to be?” That’s where gap analysis comes in. It helps find the difference between your current state and your goals. Once you find the gap, you can build a plan to bridge it.
Using PowerPoint to present this analysis makes it easier for your audience to understand the key issues, missing areas, and how to solve them. This blog will guide you through creating a clear, easy-to-understand gap analysis using step-by-step.
What Is a Gap Analysis?
Gap Analysis is a tool used to compare the actual performance of a business with its potential or desired performance.
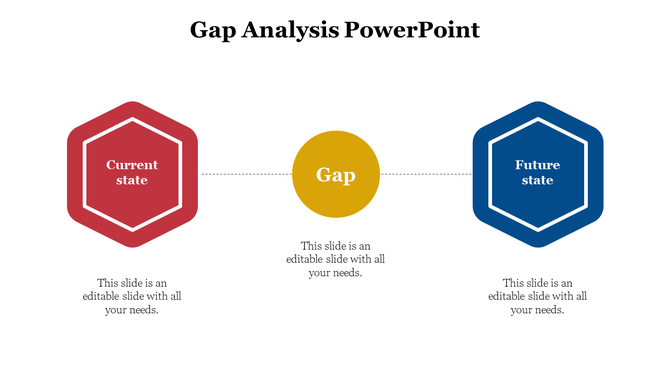
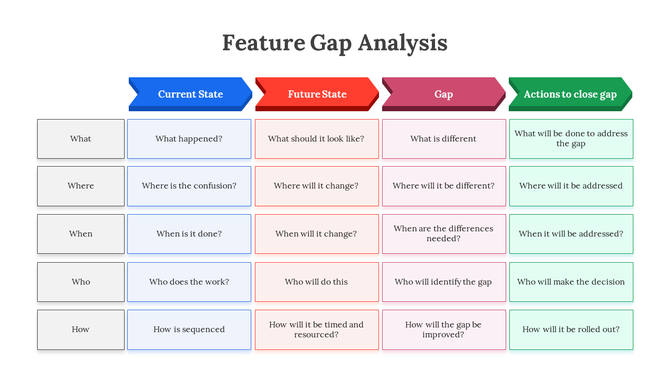
| Current State | Gap | Future State |
| Where you are now | What’s missing | Where you want to be |
Why It’s Useful:
- Highlights performance shortfalls
- Supports better planning
- Makes goal-setting realistic
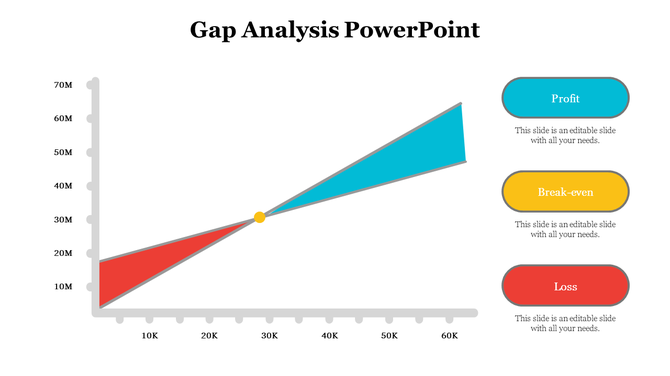
- Easy to visualize in presentations
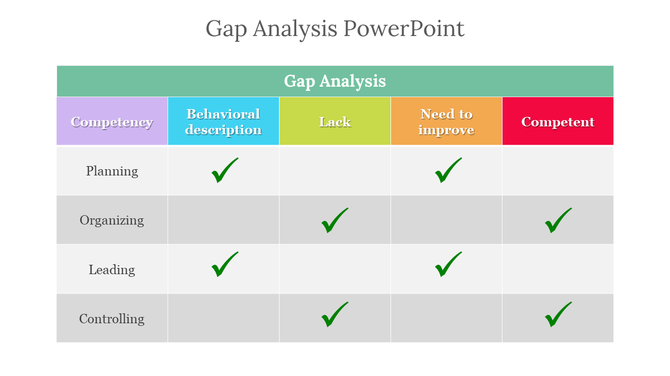
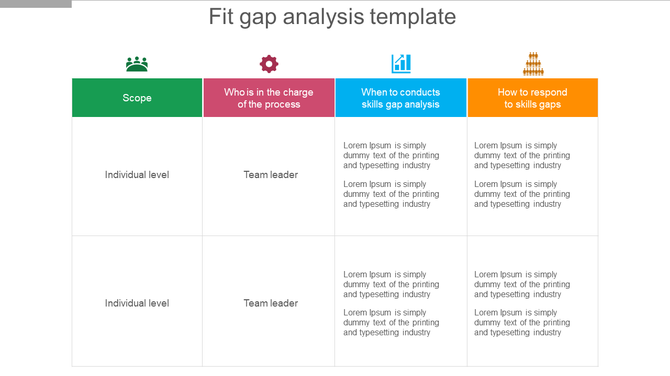
Gap analysis presentation templates can also be used to highlight your findings visually. These templates help simplify complex data and communicate your insights with clarity and professionalism.
Step-by-Step: How to Present a Gap Analysis Using PowerPoint
Step 1: Define the Current State and Future Goal
Start by identifying the present condition and the desired future outcome. This helps establish a clear direction for analysis.
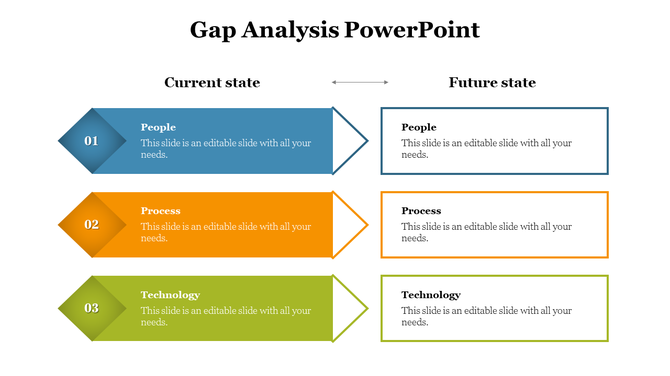
Table Example:
| Area | Current Status | Goal |
| Sales Revenue | $50,000/month | $75,000/month |
| Website Traffic | 10,000 visitors/mo | 20,000 visitors/mo |
Tips:
- Use simple language and real numbers
- Present using tables, charts, or bullet lists
Step 2: Identify the Gaps
This step focuses on what’s missing or preventing progress. Highlight the pain points and challenges.
Example Slide Layout:
- Title: “What Are the Gaps?”
- Bullet Points:
- Sales team lacks product training
- Marketing campaigns not reaching the right audience
- Website is not mobile-friendly
Visual Tip: Use diagrams or arrows to show the distance between the current and desired states.
Step 3: Categorize the Gaps
Break down the gaps into logical groups such as skills, tools, processes, or systems.
| Category | Gap Identified |
| Skills | Lack of training for new tools |
| Resources | No marketing automation software |
| Process | Long turnaround time in customer service |
This categorization helps teams prioritize what to fix first.
Step 4: Propose Solutions to Close the Gaps
List practical actions that will close each identified gap. Align each solution directly with a gap.
Example Table:
| Gap | Proposed Solution |
| Lack of product training | Weekly training sessions |
| Poor audience targeting | Redefine buyer persona, run A/B tests |
| Long support wait times | Implement chatbot for basic inquiries |
Make use of PowerPoint graphics like checklists or icons to make this slide visually appealing.
Step 5: Show Timeline and Responsibility
Assign owners and deadlines to each task. This shows accountability and progress tracking.
Timeline Example:
| Task | Owner | Deadline |
| Launch training program | HR Manager | 15th July |
| Install chatbot | IT Department | 1st August |
| Start new campaign | Marketing Lead | 20th July |
You can use Gantt charts or milestone visuals in PowerPoint to communicate timeframes.
Design Tips to Make It Visually Appealing
- Use consistent fonts and colors
- Keep slide text minimal (use bullets)
- Use icons or graphics for clarity
- Highlight key numbers and dates
Where Gap Analysis Can Be Used
Gap analysis is a flexible tool that works in many areas. Let’s look at where and how you can use it effectively:
1. Business Strategy Planning
Companies often have a vision but don’t always know how close they are to achieving it. Gap analysis helps break down long-term business goals into measurable steps. It shows where the business is falling short and what resources or efforts are needed to meet those goals.
Example:
- A company’s current market share is 10%, but it wants to reach 20% in two years. A gap analysis might reveal that marketing efforts or product innovation are insufficient.
2. Team Performance Reviews
Managers can use gap analysis to measure how well a team is performing compared to expected standards. It turns vague feedback into structured improvement points.
Example:
- A customer support team is expected to resolve tickets within 24 hours, but the average time is 36 hours. The analysis can show whether it’s due to lack of training, staffing, or software limitations.
3. Product Improvement Plans
When working on product development, a gap analysis helps identify what the product lacks compared to customer needs.
Example:
- If users are requesting mobile access but the app is only available on desktops, the gap is mobile usability. This becomes a clear development goal.
4. School Project Evaluations
Teachers and students can use gap analysis to track whether academic goals or project milestones are being met.
Example:
- A science project planned five experiments but completed only three. The gap can be due to poor planning, limited resources, or time mismanagement.
5. Customer Experience Upgrades
Gap analysis can measure the difference between customer expectations and what’s actually delivered.
Example:
- If customers expect 24/7 support but receive replies only during business hours, there’s a gap in service availability.
Adding PowerPoint templates for gap analysis to these use cases helps make your message more visual, engaging, and easier to understand for decision-makers. Explore the top 10 tips to make your presentation interactive.
Conclusion
Gap analysis doesn’t have to be confusing. With a simple PowerPoint layout, you can clearly show where improvements are needed and how to fix them. Whether you’re in sales, marketing, education, or operations, using this method helps communicate your ideas better and get team support.
FAQs
1. What is a gap analysis in business?
It compares current performance with future goals to identify missing pieces.
2. Can gap analysis be shown in PowerPoint?
Yes, it’s easy to show using tables, visuals, and bullet points.
3. What slides should be in a gap analysis deck?
Start with current state, show gaps, add solutions, and finish with a timeline.
4. Is gap analysis only for business use?
No. It can be used in education, nonprofits, and personal goal tracking.
5. What’s the benefit of showing it in slides?
Slides help people understand faster using visuals and clear layout.