A mid-year business report is a review of everything your company has done in the first half of the year. It shows the goals you had, what you achieved, where you fell short, and what plans you have for the next six months. Sharing this report through a PowerPoint presentation helps make the information more clear, visual, and easy for everyone to understand.
Using ready-made PowerPoint presentation templates saves time and helps you organize your data better. In this blog, you will learn what to include in your mid-year presentation, how to pick the best template, and how to make your report look professional and easy to follow.
📘 What Is a Mid-Year Business Report?
A mid-year business report is a summary that shows how a company has performed in the first six months of the year — usually from January to June. It compares the original business goals with what has been achieved so far. This report helps company leaders, managers, and teams understand what is working well and where improvement is needed.
It is not just about numbers. A mid-year report also talks about problems faced, customer feedback received, and plans for the second half of the year. It works like a mirror that reflects the company’s progress and helps make better decisions for the months ahead.
Why mid-year reports are important:
- Help track if the company is reaching its goals
- Show progress, achievements, and delays
- Help plan for the next six months
- Useful for team meetings, investor updates, or leadership reviews
- Build accountability and focus across departments
📊 Why Use PowerPoint for Mid-Year Business Reports?
PowerPoint is one of the easiest tools to present business updates. Instead of long written reports, you can use slides to explain your progress, problems, and plans. A presentation helps people understand important points faster by using visuals like charts and graphs.
PowerPoint also helps you explain your business journey in a step-by-step format. You can show numbers, compare data, and highlight key results without making it look confusing.
Benefits of using PowerPoint for business reports:
- Turns long reports into simple, visual slides
- Makes it easy to compare goals and results
- Helps show data through graphs, tables, and charts
- Useful for meetings, email sharing, or online sessions
- Can be edited and reused for year-end or quarterly reviews
🧾 What to Include in a Mid-Year Business Report Presentation?
To make your mid-year report effective, it should follow a clear flow. Your audience should easily understand what happened in the last six months, why it matters, and what to expect next. Each section of your report should serve a purpose and keep the audience focused.
Here’s a breakdown of what to include in your presentation:
1. Title Slide
This is the first slide of your presentation. It should clearly say what the report is about and which time period it covers. It gives your audience a quick idea of what they are about to see.
Include:
- Report title (e.g., Mid-Year Business Review 2025)
- Your name, team, or department
- Date or period covered (e.g., January to June)
- Company name or logo (if needed)
2. Executive Summary
The executive summary is a short overview of the full report. It gives the audience a snapshot of how the business performed. This helps people understand the key results before you go into the full details.
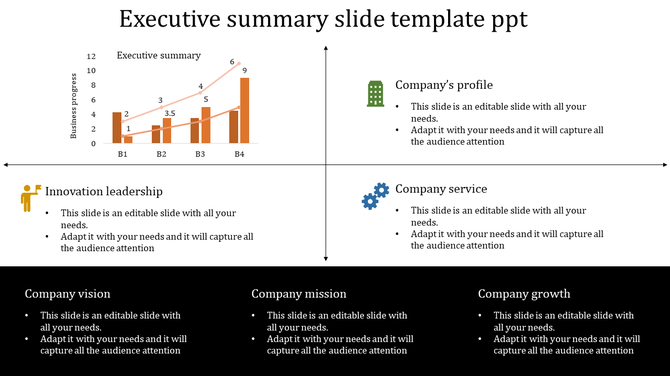
Include:
- A brief statement about overall business performance
- Key wins or milestones achieved
- A note on financial results or major changes
- Main topics that the report will cover next
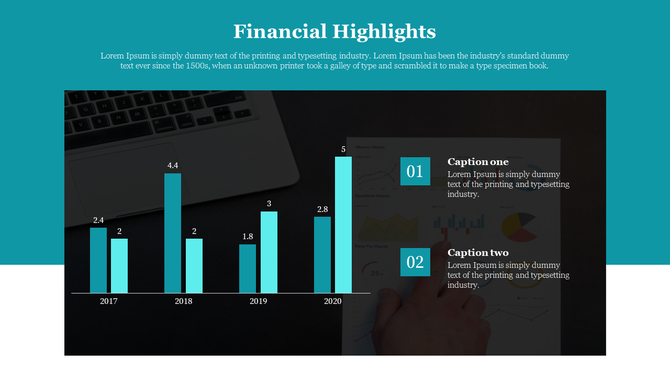
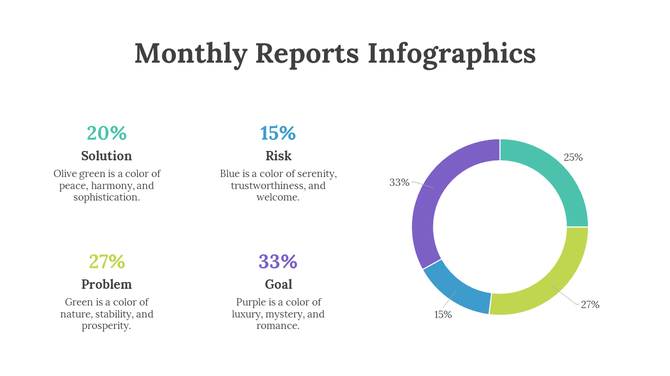
3. Goals vs. Achievements
This part compares what your business planned at the beginning of the year and what was actually done. It helps show progress and areas that need improvement. Use visuals to make the comparison easy to understand.
Include:
- List of planned goals (monthly/quarterly/overall)
- Actual results or completion rate
- Comparison charts (bar, line, or percentage)
- Comments on success and gaps
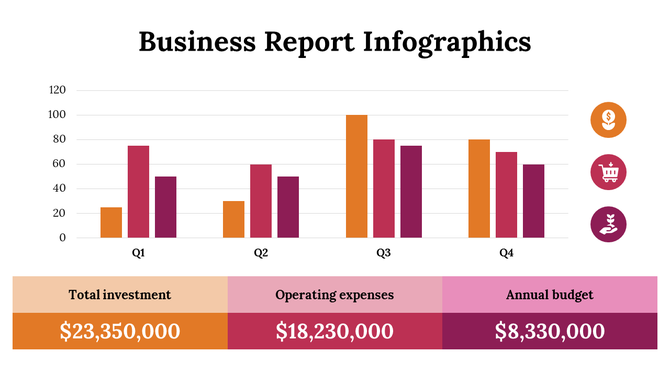
4. Sales and Revenue Update
Sales and revenue are very important in any business report. This section shows how much money was earned, which products or services performed best, and how your numbers compare to previous years or quarters.
Include:
- Total revenue and profit (for the half-year)
- Sales growth or decline trends
- Best-selling products or services
- Graphs or tables to explain numbers clearly
5. Department-Wise Highlights
If your company has different departments (like Sales, HR, Marketing, or Finance), this section shows what each team achieved. It helps give credit to different groups and shows teamwork.
Include:
- Short updates for each department
- Key tasks completed or milestones achieved
- Graphs, images, or icons for quick understanding
- Team performance comparisons (if needed)
6. Challenges and Solutions
No business runs without facing problems. This section is important because it shows how your team dealt with challenges and what lessons were learned. It builds trust when you show honesty and responsibility.
Include:
- List of main problems or delays faced during the first half
- Reasons behind those issues (if known)
- How the team responded or solved the problem
- Any changes in process to avoid future risks
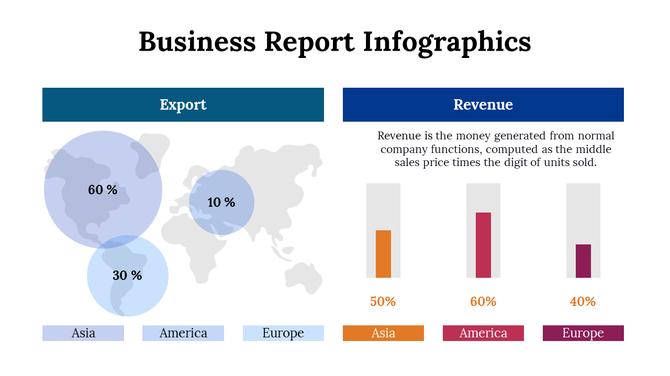
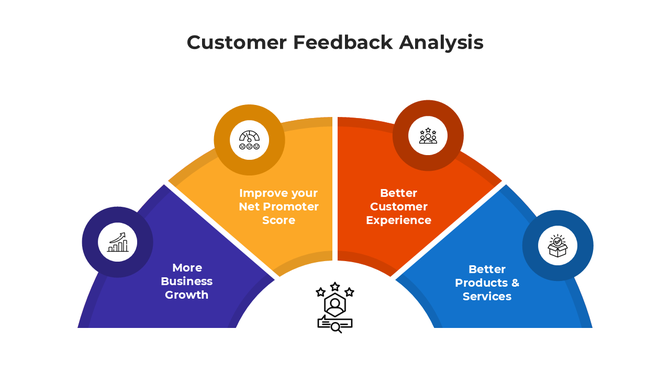
7. Customer or Market Feedback
Feedback shows how customers or the market feel about your company. This can include direct reviews, survey results, or comments from partners. It helps your team know how people view your product, service, or brand.
Include:
- Customer satisfaction scores (if available)
- Quotes or testimonials from clients
- Market trends or customer behavior changes
- Action taken based on feedback (e.g., improved service or product changes)
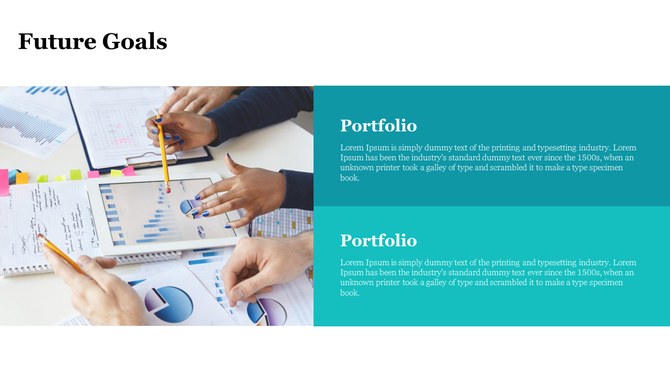
8. Plans for the Next 6 Months
This section talks about what the company wants to do from now until the end of the year. It gives direction and keeps everyone aligned.
Include:
- Main business goals for the second half
- Upcoming projects or campaigns
- Deadlines or project timelines
- Changes in team structure or focus
- Resources or support needed
9. Conclusion and Q&A
This is the final part of your presentation. It helps your audience remember the most important points and gives them a chance to ask questions or give feedback.
Include:
- A quick summary of key points from the report
- Thank you message for attention and time
- Invite questions or open discussion
- Contact details (if needed)
How to Choose the Best Template for Your Mid-Year Report?
Not every template works for every report. The right PowerPoint template helps you share your message clearly and professionally. A good template saves time, looks clean, and keeps your audience focused.
Here’s how to choose the best one:
✅ Clean and Simple Design
Use templates that have neat layouts, clear text, and balanced spacing. Avoid too many colors or heavy backgrounds.
Look for:
- Neutral colors (blue, grey, white)
- Clear headings and simple fonts
- Balanced use of space
✅ Slides for Data and Charts
Choose a template that includes slides for numbers and charts. You need to show growth, revenue, or goals clearly.
Look for:
- Bar charts, pie charts, and line graphs
- KPI dashboards and comparison tables
- Timeline or roadmap visuals
✅ Easy to Edit
Templates should allow you to make quick changes to text, color, and layout without design skills.
Look for:
- Editable text boxes
- Simple icon and color updates
- Font and layout consistency
✅ Slide Variety
You need more than just text slides. The template should have slides for quotes, images, team members, and charts.
Look for:
- Title slides
- Two-column content slides
- Image with caption
- Comparison and summary slides
Tips to Improve Your Mid-Year Presentation
Even with a good template, a few smart choices can help you learn how to prepare a weekly business report or mid-year report more effectively and professionally..
Tips to follow:
- Use short bullet points instead of full paragraphs
- Avoid putting too much text on one slide
- Keep fonts and colors consistent
- Use graphs and icons to explain data visually
- Practice the flow of your slides before the meeting
- Leave time for questions or team input
Final Thoughts
A mid-year business report helps your company reflect on its journey so far and plan for what’s next. Turning that report into a PowerPoint presentation makes it easier to explain, share, and understand. The right template, clear structure, and simple design can turn even complex data into a clean and impactful story.
You don’t need to be a designer to create a good report. Just follow the basics: clear slides, simple visuals, honest content, and steady flow. This is the best way to make your business update easy for everyone to follow and remember.
Frequently Asked Questions (FAQs)
1. What is a mid-year business report?
A mid-year business report is a review of your company’s progress during the first half of the year.
2. Why is it important to present a mid-year report in PowerPoint?
It helps you show your results clearly using charts, slides, and visuals that are easy to understand.
3. What should I include in a mid-year report presentation?
Include your goals, achievements, sales, challenges, team updates, customer feedback, and future plans.
4. How can I make my business presentation look professional?
Use a clean template, short bullet points, simple fonts, and clear charts or graphs.