
Infographics are a great way to communicate complex information in a visually appealing and easy-to-understand. It can be used in a variety of settings, including presentations, reports, and marketing materials. If you’re looking to add infographics to your Google Slides templates, but you’re not sure how?
This blog post is for you. In this post, I’ll show you how to insert infographics in Google Slides, using both free and paid resources.
Why Infographics Matter
Infographics are more than just eye-catching designs – they serve as a powerful tool to communicate data, statistics, and concepts in a visually appealing and memorable way.
By combining imagery, text, and design elements, infographics allow you to simplify complex information, making it accessible to a broader audience.
Inserting Infographics in Google Slides
Google Slides is a user-friendly platform, to create dynamic presentations, and adding infographics is a breeze. Here’s a step-by-step guide to get you started:
- Choose or Create Your Infographic: Before inserting an infographic, ensure a clear and visually appealing design is ready. You can create one from scratch using tools like Canva or Adobe Illustrator or choose from various online templates.
- Open Your Presentation: Log in to your Google account and open the Google Slides presentation where you want to insert the infographic.
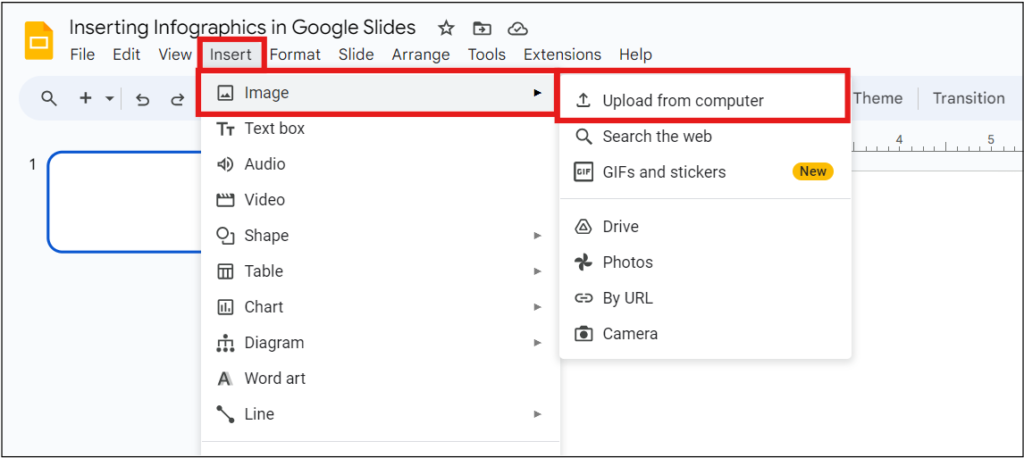
- Insert an Image: Click on the slide where you want the infographic to appear. Then, go to the “Insert” menu and select “Image.” Choose the source of your infographic – it can be from your computer, Google Drive, or even a direct URL.
- Adjust Size and Position: Once inserted, you can resize and reposition the infographic to fit the slide perfectly. Click on the image, then drag the corners to resize, and use the alignment tools to center it.
- Add a Title and Captions: To provide context, consider adding a title above the infographic and captions below it. This helps the audience understand the significance of the visuals.
- Link to the Source: If your infographic references external data or sources, consider including a hyperlink on the infographic or in the slide’s notes to provide easy access for those who want to explore further.
Tips and Tricks for Infographic Success
- Keep it Simple: The beauty of infographics lies in their simplicity. Stick to a clear and concise message, avoiding clutter and overwhelming visuals.
- Choose Appropriate Colors: Color choices can evoke emotions and convey meaning. Ensure your color palette aligns with your content and maintains readability.
- Use Icons and Symbols: Icons and symbols can replace lengthy text, enhancing understanding and adding visual interest.
- Tell a Story: Arrange your infographic elements in a logical sequence, leading the viewer through a narrative. A well-structured flow helps information retention.
- Visual Consistency: Maintain a consistent design style throughout your presentation. This builds a sense of coherence and professionalism.
- Use Charts and Graphs: For data-driven infographics, integrate charts and graphs to provide context and enhance clarity.
- Whitespace Matters: Don’t underestimate the power of whitespace. It aids readability and highlights key information.
- Test for Readability: Before presenting, ensure your infographic is readable from a distance. What looks good on your screen might not be as legible on a projector.
- Animate with Purpose: If you choose to add animations to your infographic, make sure they serve a purpose and don’t distract from the content.
Follow these tips and introduce them in your presentation to get more applause. To get more tips and tricks-related presentations, visit the Slide Egg.
Conclusion
Inserting infographics into Google Slides is a fantastic way to elevate your presentations and captivate your audience. By following the steps outlined in this guide and incorporating the tips and tricks provided, you’ll be well on your way to creating impactful visuals that enhance the clarity and effectiveness of your communication.