Timeline Chart PowerPoint And Google Slides Template

Timeline Chart PowerPoint Template
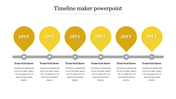
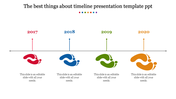
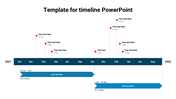
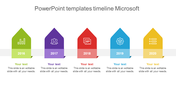
A Timeline Chart is a graphical representation of events or tasks arranged sequentially along a horizontal axis, typically used to visualize project schedules, historical timelines, or personal timelines. Various professionals and individuals use Timeline Charts for different purposes. Project managers utilize them to plan and track project milestones, deadlines, and dependencies. Event planners rely on Timeline Charts to coordinate and schedule activities leading up to an event. In the specified yellow-colored template, the yellow hue likely represents energy, optimism, and creativity, adding vibrancy to the timeline while ensuring clarity and visibility of the events or tasks depicted.
Features of this template
- 100% customizable slides and easy to download.
- The slide contains 16:9 and 4:3 formats.
- Easy to change the colors of the slide quickly.
- Highly compatible with PowerPoint and Google Slides.


You May Also Like These PowerPoint Templates
Add to Wishlist
Download
AI Customize

Add to Wishlist
Download
AI Customize

Add to Wishlist
Download
AI Customize

Add to Wishlist
Download
AI Customize

Add to Wishlist
Download
AI Customize

Add to Wishlist
Download
AI Customize

Add to Wishlist
Download
AI Customize

Add to Wishlist
Download
AI Customize


Add to Wishlist
Download
AI Customize

Add to Wishlist
Download
AI Customize

Add to Wishlist
Download
AI Customize

Add to Wishlist
Download
AI Customize

Add to Wishlist
Download
AI Customize

Add to Wishlist
Download
AI Customize

Add to Wishlist
Download
AI Customize

Add to Wishlist
Download
AI Customize


Add to Wishlist
Download
AI Customize
