PowerPoint Infographics Template And Google Slides

Circular infographic with eight numbered steps, color-coded in blue, red, orange, and purple, forming a square layout.
P.ID : 8583
    320 views
    10 Downloads
    Get Custom Slides by Experts
    Instantly Access Templates in PowerPoint

    PowerPoint Infographics Template


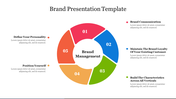
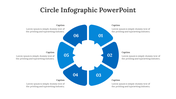
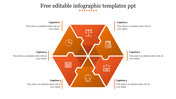
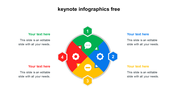
    Upgrade your presentations towards progression by introducing our PowerPoint Infographics And Google Slides Template. The slide has an arrangement of eight colorful grids arranged in the shape of a plus sign. It further creates an eye-catching centerpiece for your infographics. Surrounding the core image, eight sets of captions provide additional details.

    Ideal for professionals in marketing, business analytics, education and more. Suitable for illustrating market trends, presenting survey results or showcasing project milestones. Download the template today to effectively communicate your message.

    Features of the template

    • The slide contains 16:9 and 4:3 formats.
    • Compatible with Google slide themes and PowerPoint.
    • 100% customizable slides and easy to download.
    • It is easy to change the colors of the slide quickly.
    • Well-crafted template with an instant download facility.
    Advertisement

    You May Also Like These PowerPoint Templates

    Add to Wishlist
    Download
    AI Customize
    Color-coded cycle diagram displaying six key processes linked to carbon and ecological cycles, each with placeholder text.
    Add to Wishlist
    Download
    AI Customize
    A circular infographic illustrating the customer journey experience map, featuring seven stages with descriptive text.
    Add to Wishlist
    Download
    AI Customize
    Four-level pyramid infographic with layers in green, orange, blue, and red, each labeled with icons and captions areas.
    Add to Wishlist
    Download
    AI Customize
    Circular diagram with four green segments illustrating communication methods, featuring central globe icon.
    Add to Wishlist
    Download
    AI Customize
    Red segmented pyramid graphic with accompanying numbered captions and text boxes for content.
    Add to Wishlist
    Download
    AI Customize
    Circular arrangement of nine yellow triangular segments, each with an icon, surrounding a central handshake symbol.
    Add to Wishlist
    Download
    AI Customize
    Slide featuring a wheel diagram with five colorful segments and icons representing different market aspects.
    Add to Wishlist
    Download
    AI Customize
    3D pentagonal infographic with five colorful sections in yellow, green, orange, blue, and red, each labeled 01 to 05.
    Add to Wishlist
    Download
    AI Customize
    Orange 3D pyramid with four segments, each labeled with numbers, icons, and descriptive beige captions.
    Add to Wishlist
    Download
    AI Customize
    A circular diagram with a gray heart icon surrounded by three orange segments, each featuring medical symbols and captions.
    Free
    Add to Wishlist
    Download
    AI Customize
    Circular blue infographic with five sections around a central team icon, each labeled with captions.
    Add to Wishlist
    Download
    AI Customize
    Pyramid diagram in varying shades of purple with three labeled segments and corresponding icons aligned on the right.
    Add to Wishlist
    Download
    AI Customize
    Colorful circular flow diagram slide with five segments, each labeled with captions and additional text sections on the side.
    Free
    Add to Wishlist
    Download
    AI Customize
    Circular infographic template with blue gradient segments and icons surrounding a central thumbs-up graphic.
    Add to Wishlist
    Download
    AI Customize
    Recruitment slide with a five-part circular diagram highlighting methods like school placement and voluntary application.
    Free
    Add to Wishlist
    Download
    AI Customize
    Circular infographic with a central thumbs up, surrounded by four orange segments each containing icons.
    Add to Wishlist
    Download
    AI Customize
    Circular diagram with six colored segments, numbered 1 to 6, with corresponding captions on both sides.