Free Table Presentation Templates
Turn messy data into clear insights with our Table Presentation Templates. Use modern, easy-to-read table layouts for reports, project updates, pricing plans, and KPI dashboards. Fully editable in PowerPoint, Google Slides, and Canva—so you can build professional slides faster and stay consistent. No alignment stress—just tables, every time—fast!


 PPT Template")


Improve Your Presentations Using a Table Template
Why Table Templates Make Slides Better
- Instant clarity: Your data looks organized and easier to scan.
- Faster slide creation: Replace text and numbers—no redesign needed.
- Business Look: Consistent space, fonts, and headers.
- Improved comparisons: Ideal for features, plans, providers, and data.
- Easy edits: Add or remove rows and columns without breaking the design.


What You Can Create With the SlideEgg Table PowerPoint Templates
1) Comparison tables: Perfect for comparing different options side by side. A professional comparison table template is useful for evaluating product characteristics with competitors, comparing tools, and selecting vendors.
- Viewers can scan rows and instantly spot differences.
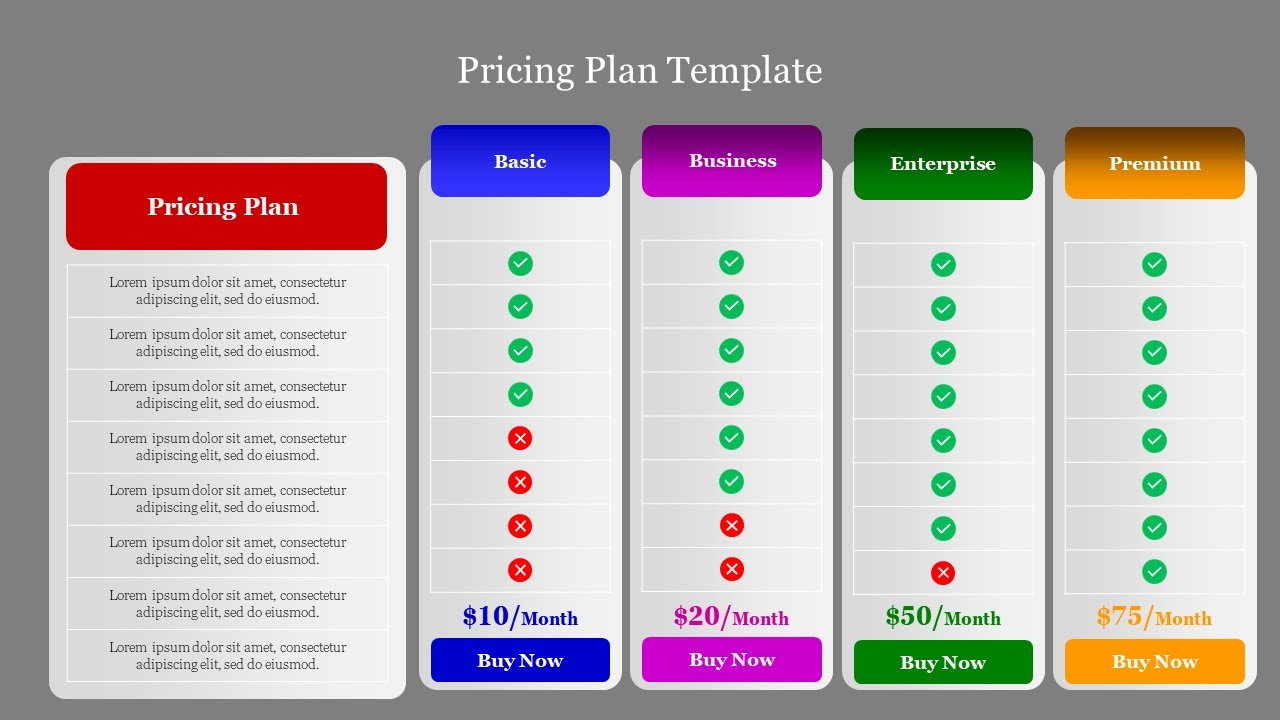
2) Pricing tables: A clean pricing table makes offers feel more professional and easier to trust. Use these to show packages, tiers, add-ons, and bundle deals clearly.
- A structured layout reduces confusion and helps people decide faster.
3) KPI and metrics tables: Great for reporting performance in a simple, readable format. These KPI dashboard templates are ideal for target vs. achieved results and department-wise metrics.
- Leadership teams prefer quick “at a glance” numbers without extra explanation.
4) Project status tables: It's among the most frequently used methods for business presentations. A project status table is useful in monitoring task names, responsible persons, due dates, and present status.
- It will give instant clarity on what’s moving and what needs attention.
5) Budget and expense tables: Useful for planning and tracking costs without confusing spreadsheets. A dedicated budget slide helps you show cost categories, actual vs. planned spending, and forecasts.
- Tables keep financial data neat and presentation-friendly.
6) Schedules and trackers: When it comes to timelines that do not need complex graphs, table slides are the best option. The timetable design is utilised in making weekly plans, training schedules, content calendars, attendance logs, and task trackers.
- It is simple, direct, and very easy to change from one week to another.
7) Summary tables: Use summary tables to wrap up meetings with clear takeaways and ensure professional consistency.
- Main points and decisions.
- Risks and Mitigation
- Action items and owners
- Next steps and due dates
- It turns messy meeting notes into a clean, professional summary.
Who can use these Table PPT Templates?
- Business Teams: Teams use tables in reports, meetings, proposals, and reviews. Table slides make it easy to present updates without messy formatting. They are excellent for the KPI dashboards, performance appraisals, and progress updates.
- Sales and Marketing: Cost and comparing slides are common in sales presentations. A clean table makes your offer easy to understand. It also reduces questions like "What is included in this plan?" because the details are shown clearly.
- HR and Operations: HR teams use tables for policies, training schedules, onboarding plans, and attendance tracking. They are used by operations teams for the purpose of task assignment, schedule planning, and process checklist creation.
- Students and Teachers: It is a common requirement for students to display the results of surveys, summarize research, and compare projects. Teachers use tables to share structured lessons, class plans, and assessment details. Table templates help keep the presentation neat and easy to follow.
- Analysts and Researchers: When your work includes data, your slides must be readable. Table layouts help you show results and comparisons in a way that feels organized, not crowded.


- It has fully adjustable layouts and allows you to simply change the text, numbers, colors, and fonts.
- Simple row and column controls for adding, removing, and editing content.
- Clean headers and label styles to guide the reader’s eye.
- Planning and highlighting to emphasise critical values, totals, or top-tier plans.
- Instead of a standard strategy, flexible designs are tailored to specific application cases.
- Presentation-ready formats that look fantastic on screen and in PDF exports.
Tips to Make Table Slides Look Great
- We keep the headings short and simple.
- Limit columns when possible (3 to 5 columns are easier to read)
- Use one row style for data and one for totals or key points
- Highlight only the numbers that matter most
- If the table is large, split it into two slides
- A short title should be added that gives the audience an idea of the table's significance.
- By making these small changes, your presentation will look less heavy and more professional.
Make Your Next Data Slide Easy to Understand
Become an expert with SlideEgg

We're here to help you!
Are these table templates editable in PowerPoint?
Yes. Text, numerical values, font styles, colors, and even the addition or deletion of rows and columns can all be changed.
Can I use Google Slides with these templates?
Yes. You can select the "Google Slides" option directly from the download menu. This opens a copy of a template instantly in Google Slides for easy editing.
Can I still compare plans and costs using these templates?
Yes. Many table designs are made to show pricing tiers clearly.
Are these templates good for business reports and dashboards?
Currently, they are excellent for KPIs, weekly updates, project status, and performance summaries.
What is the process for creating a personalized table style in PowerPoint?
Make a table and style it with your selected fonts, colors, and borders. After that, either keep it in the Slide Master or as a part of a template so that the same table style can be easily applied in the next slides.
How do I insert a table in PowerPoint?
Insert → Table, choose the number of rows and columns, and populate them with your data. To save time, you can also choose a table template and replace the sample text with your own.
How do Table Slides improve presentations?
Table slides enable the easy organization and comparability of data. They keep your slides neat and polished, let the audience rapidly understand all the important information, and reduce confusion.