200+ Free Table PowerPoint Templates
Use SlideEgg’s free table PowerPoint templates to organize data, comparisons, pricing plans, project updates, KPI reports, schedules, and business summaries in a clean visual format. These editable table slides work with PowerPoint, Google Slides, and Canva, helping you create professional data-focused presentations without building tables from scratch.
Editor's Choice (1 of5)
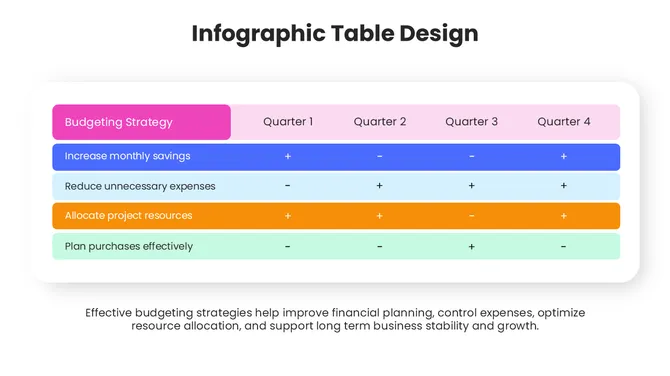
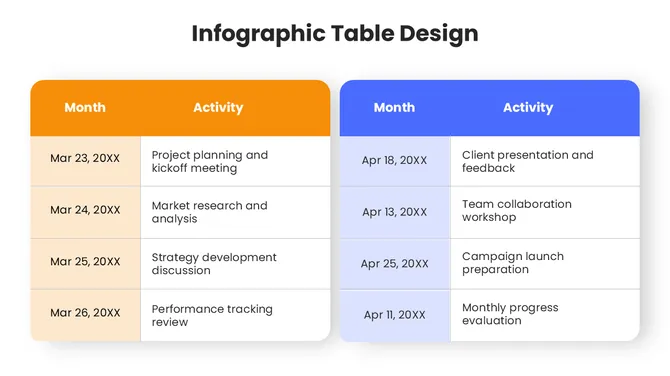
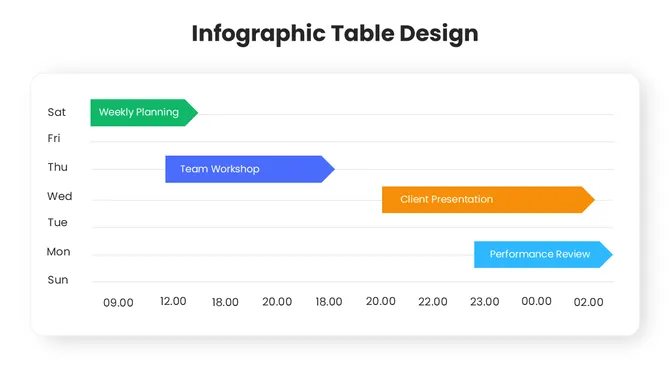
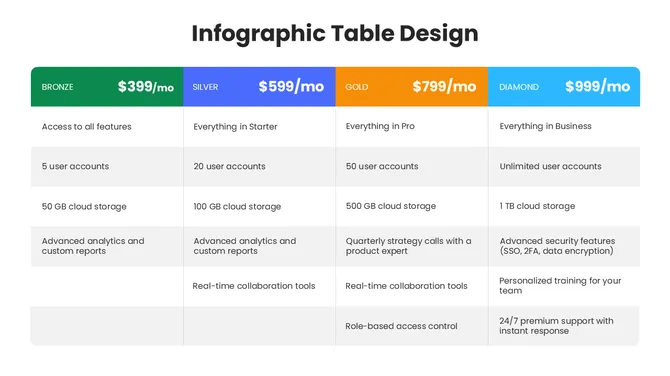
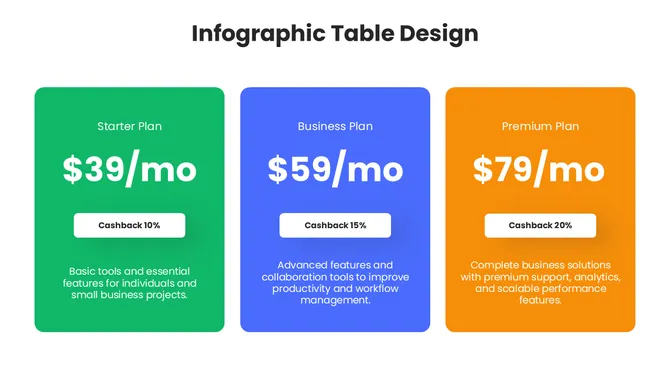
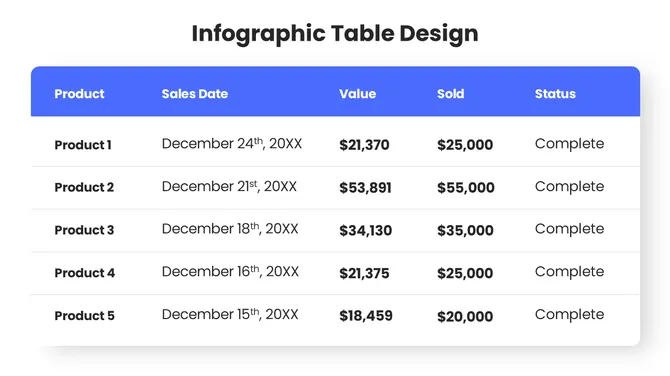
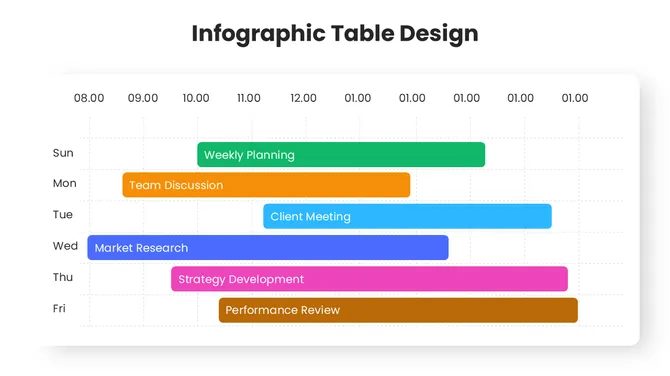

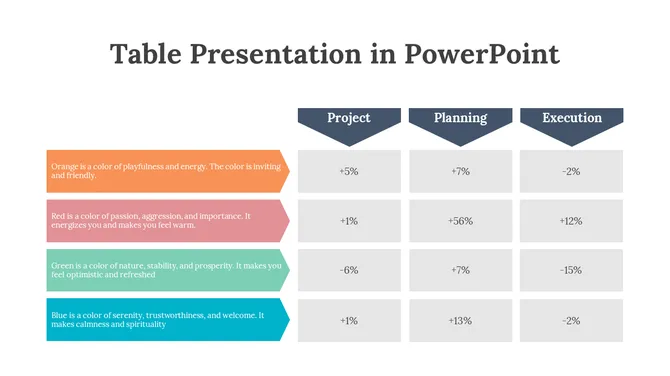
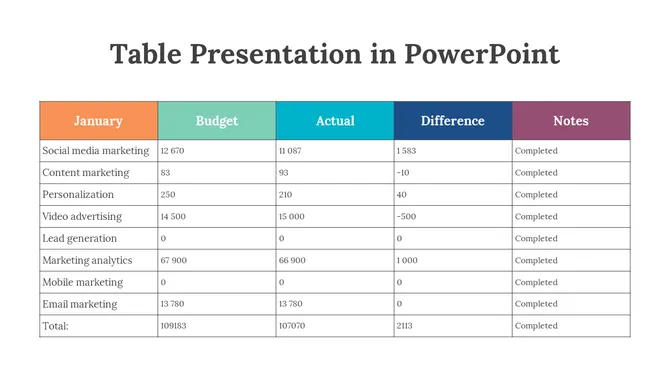
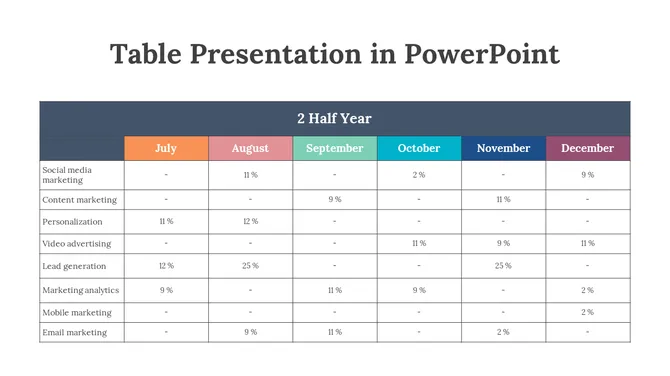
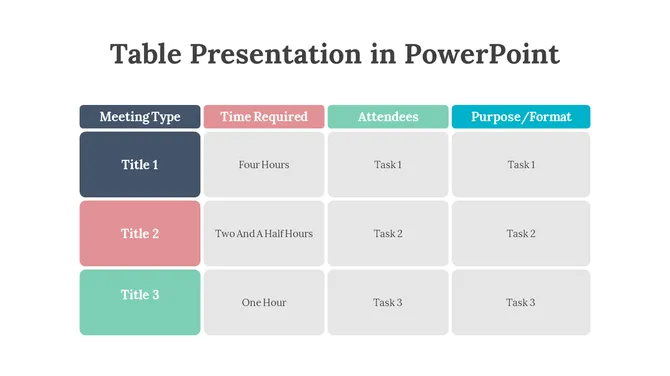
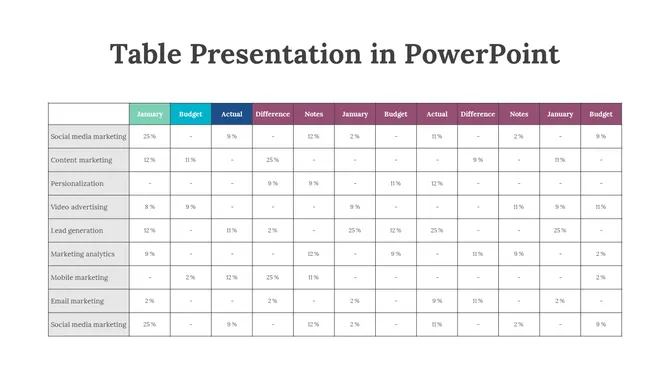
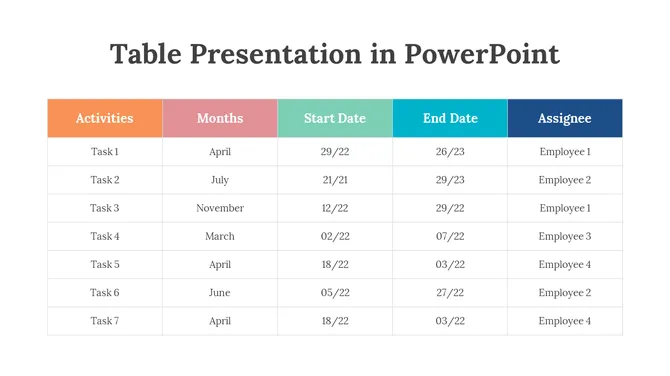
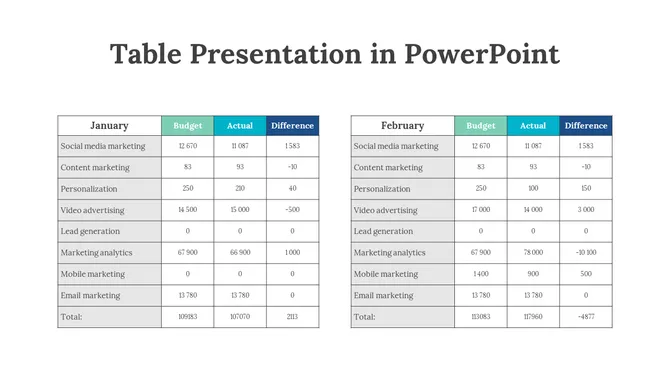
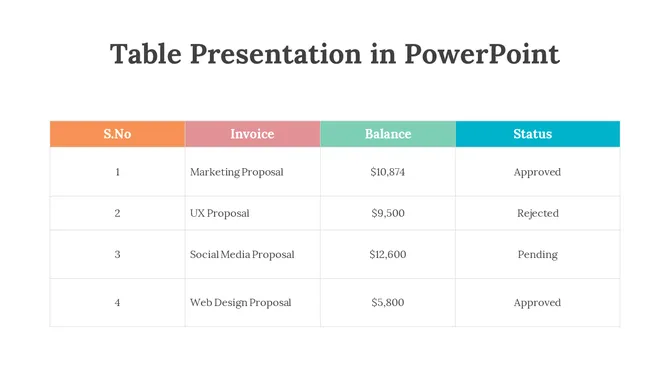
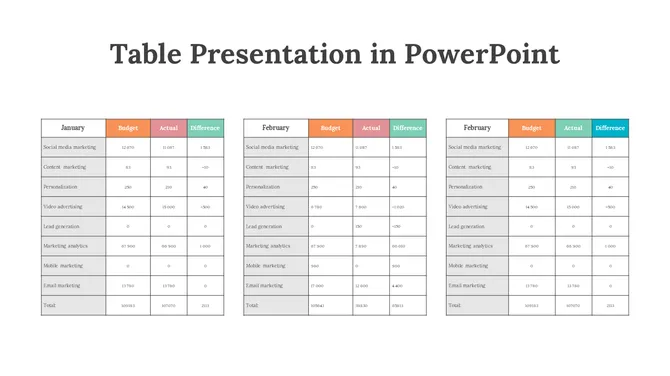

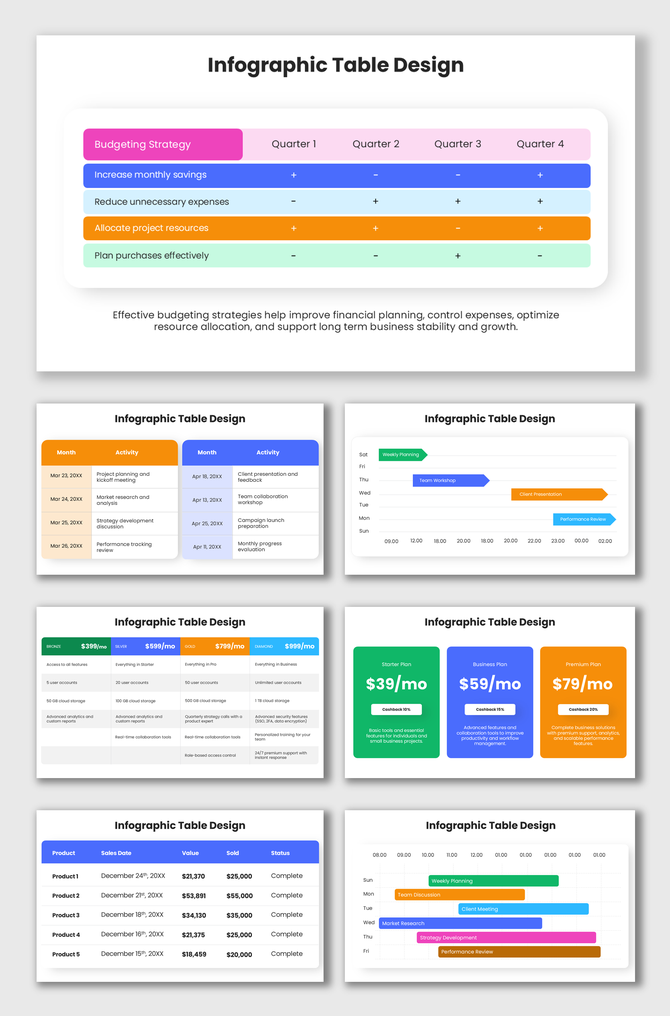
This slide presents a quarterly budgeting strategy table with four colored action rows. It compares monthly savings, expense control, resource allocation, and purchase planning across Quarter 1 to Quarter 4 using simple plus and minus symbols.
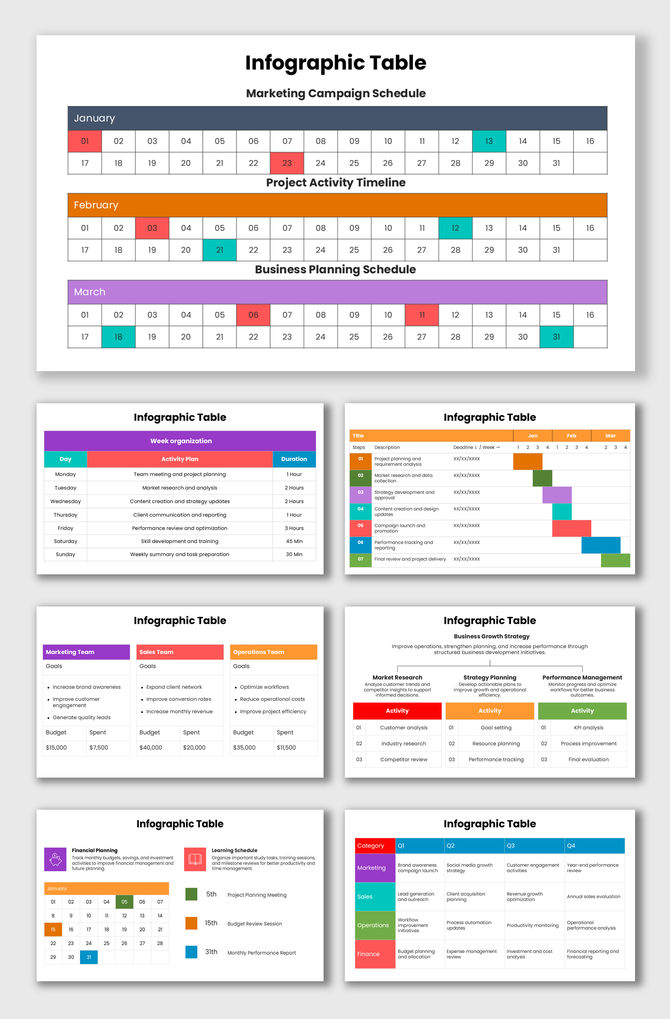
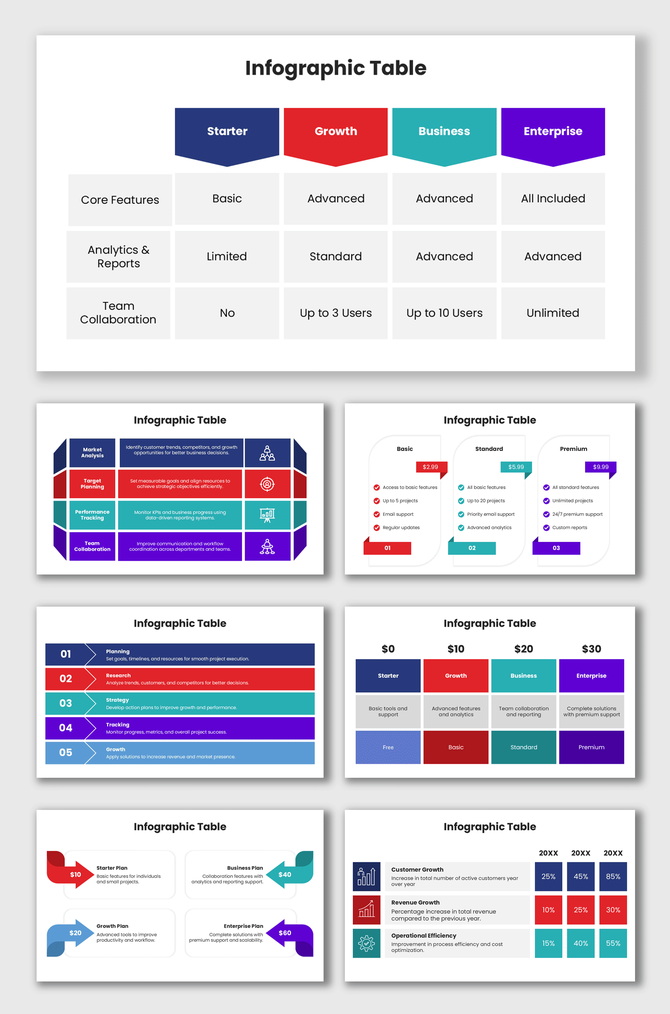
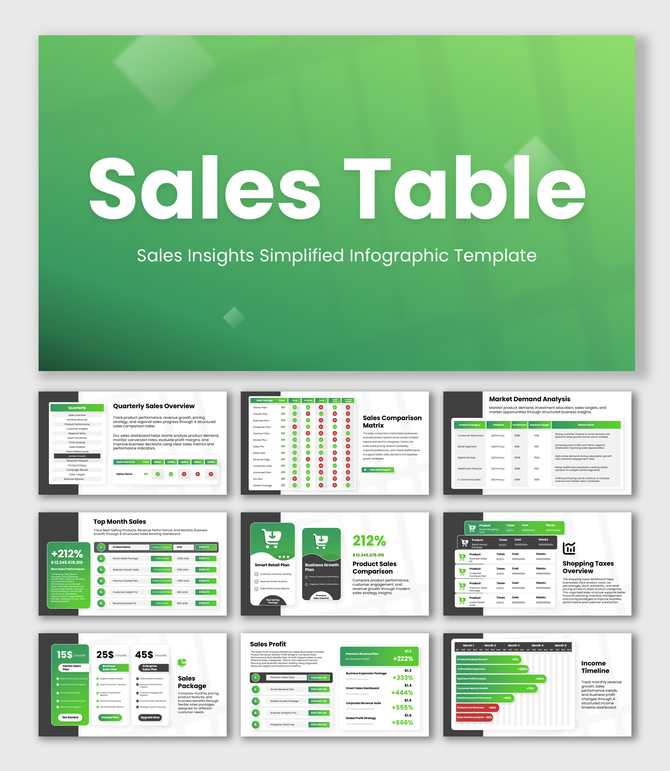
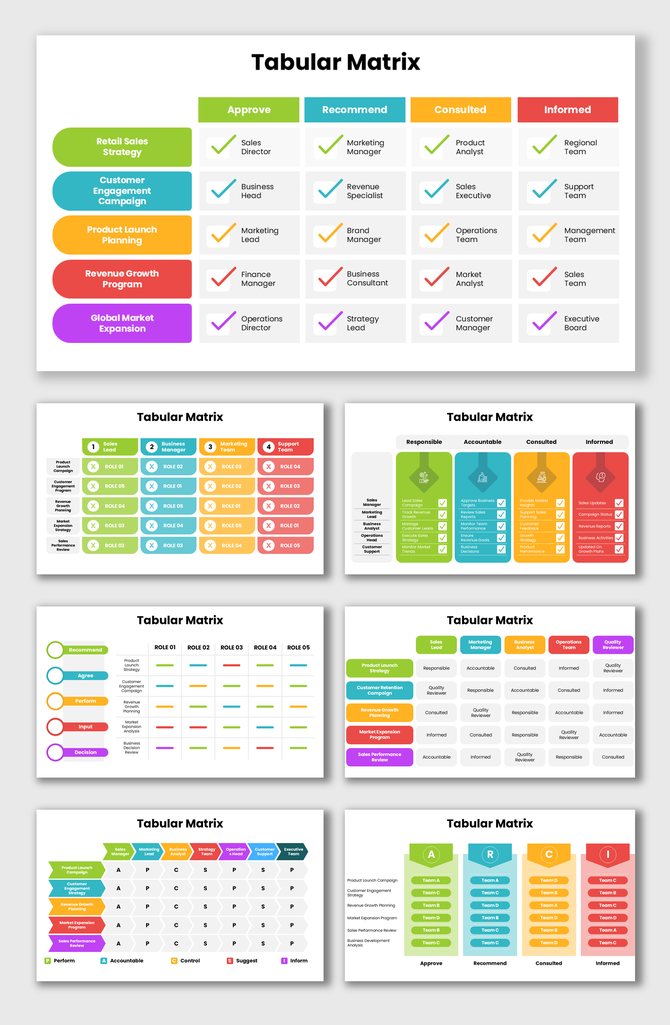
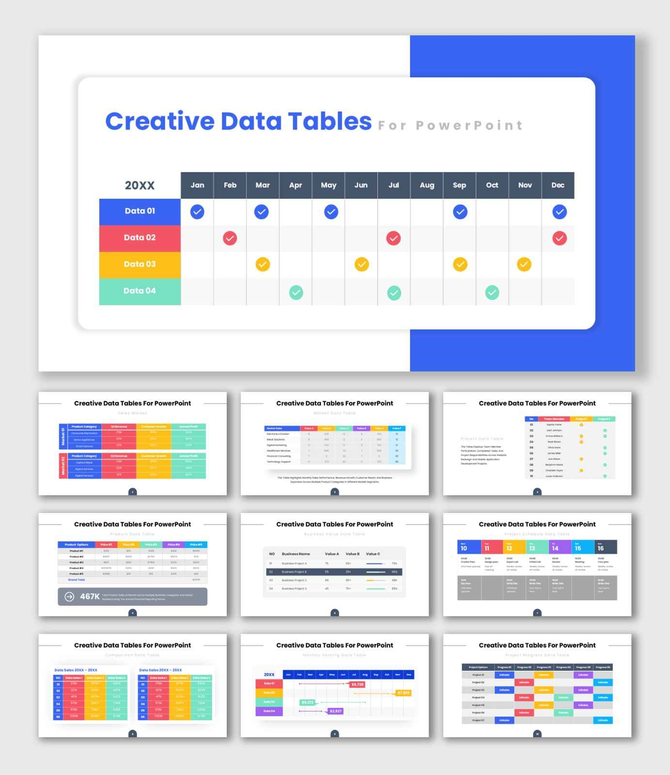
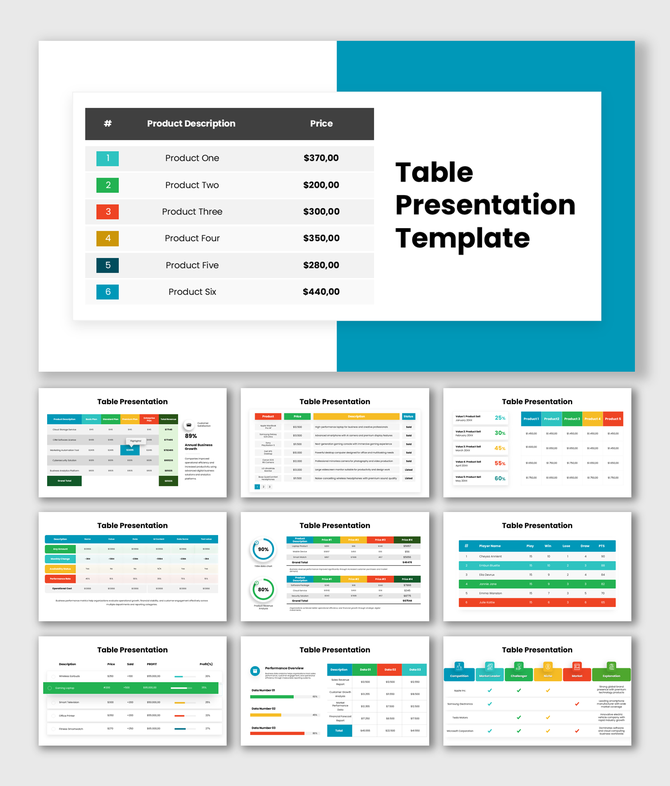
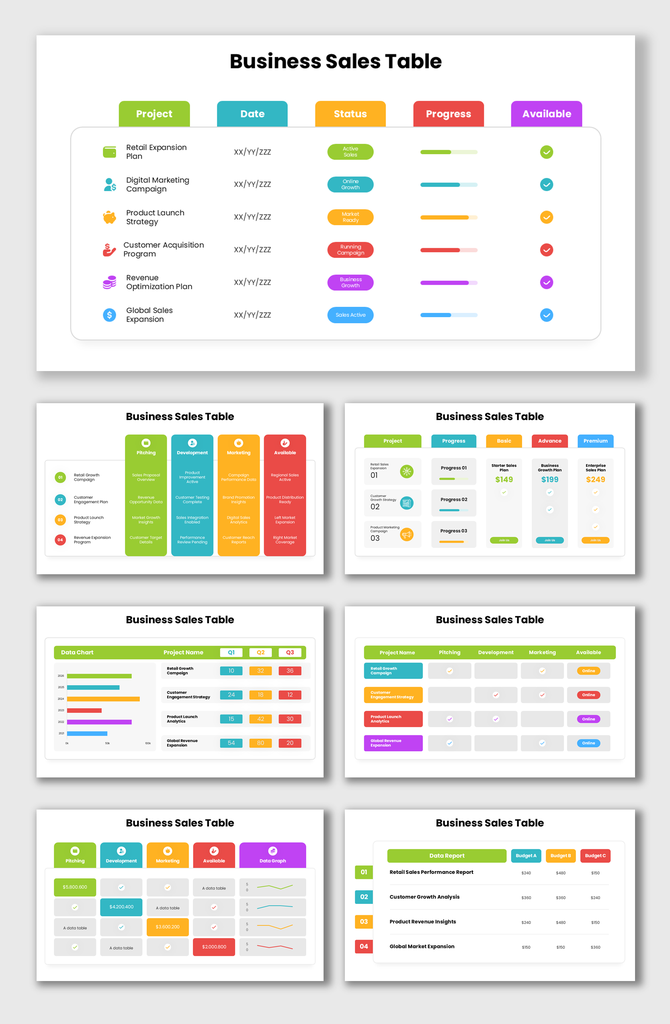
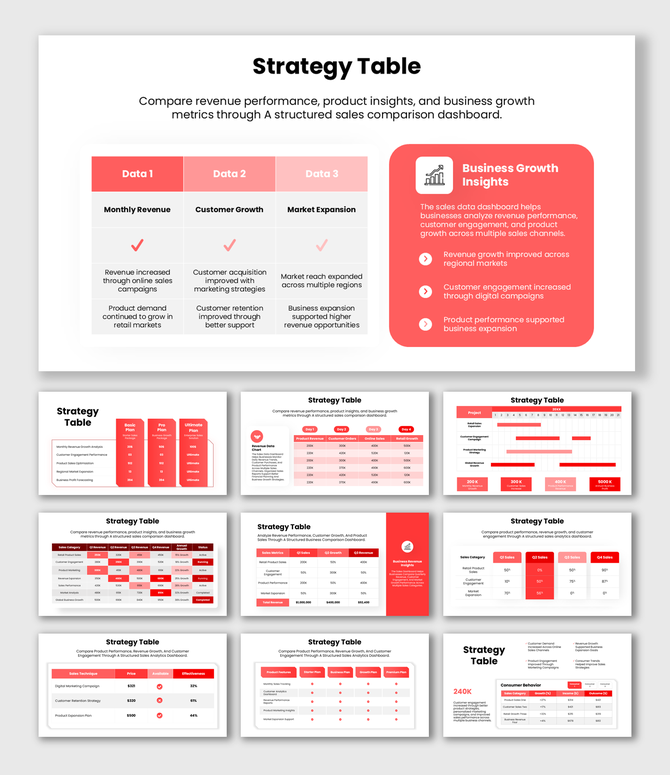
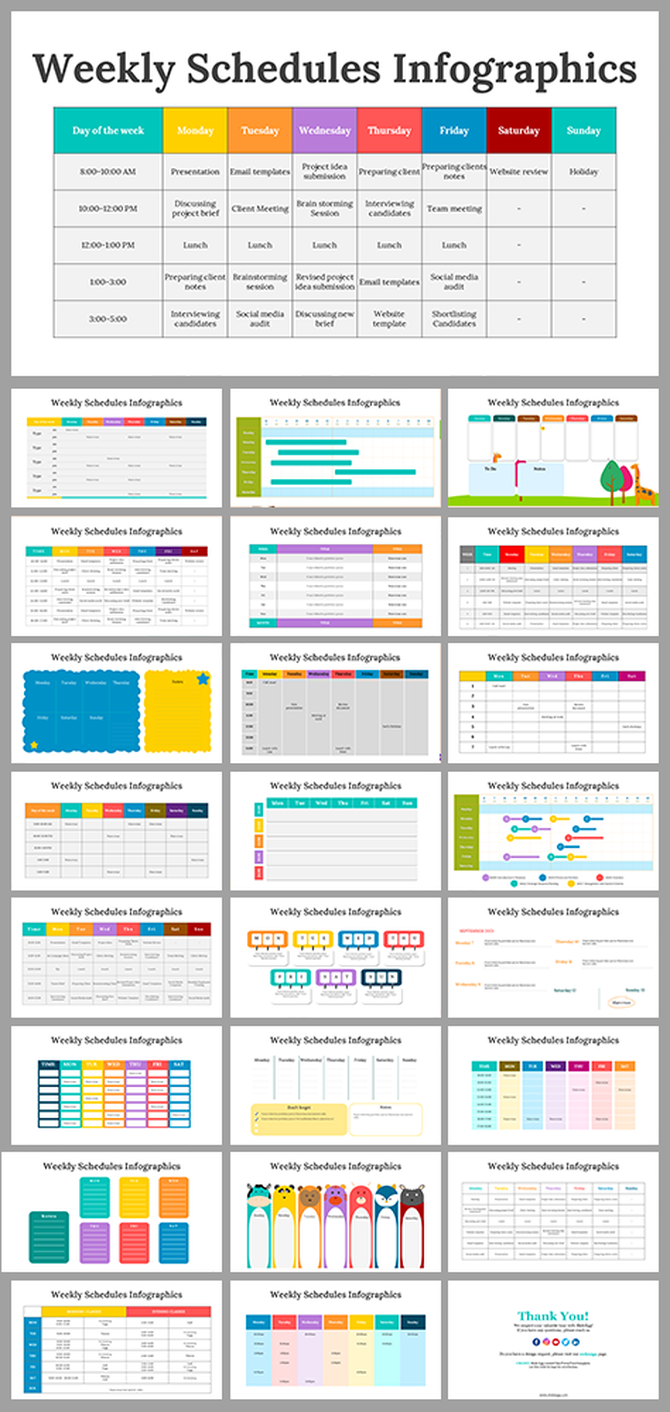
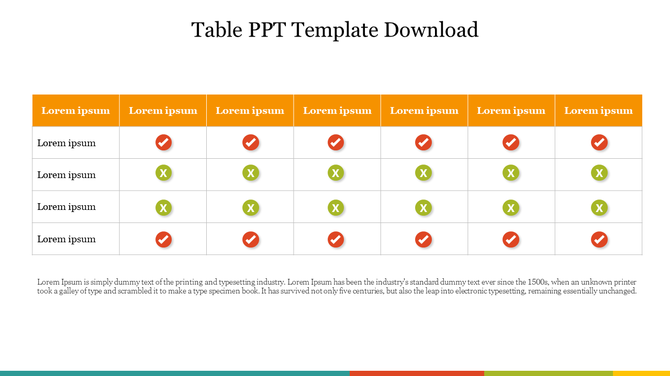
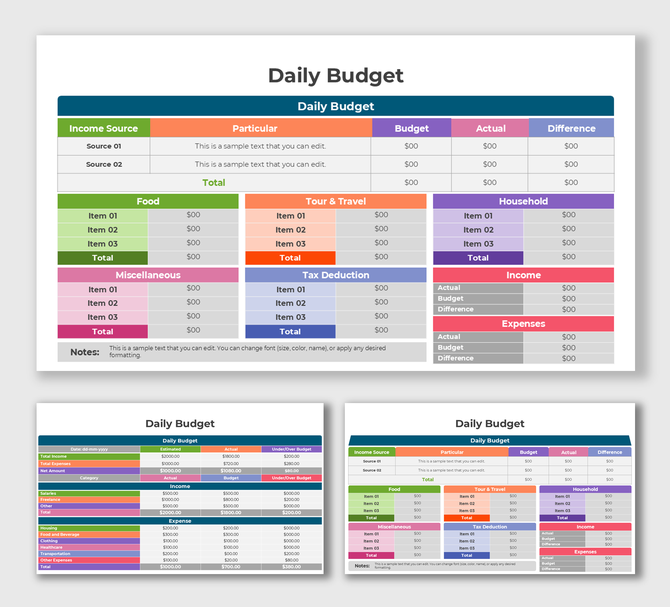
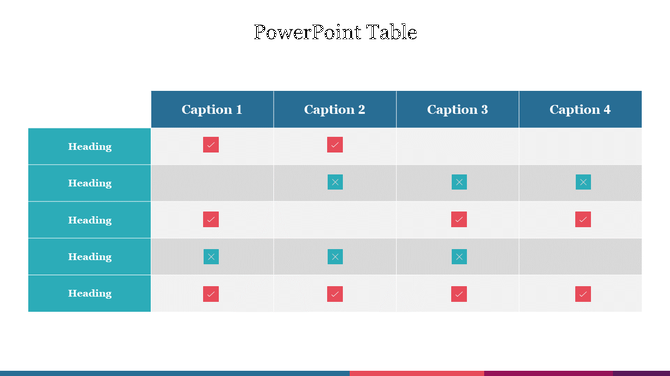
Editable Table Presentation Templates for Reports, Pricing, and Data Slides
Table presentation templates help you show structured information clearly without overcrowding your slides. Instead of spending time adjusting rows, columns, spacing, and alignment, you can start with a ready-made table layout and replace the sample content with your own data. These templates are useful for business reports, pricing plans, product comparisons, KPI updates, project tracking, meeting summaries, schedules, and dashboards.
Why Table Templates Make Data Slides Easier to Read
- Table templates improve slide clarity by giving your information a clean structure. They help users organize rows, columns, values, and labels in a readable format. You can replace sample text and numbers without redesigning the slide, keep spacing and alignment consistent, compare features or pricing clearly, and customize rows or columns based on your content.
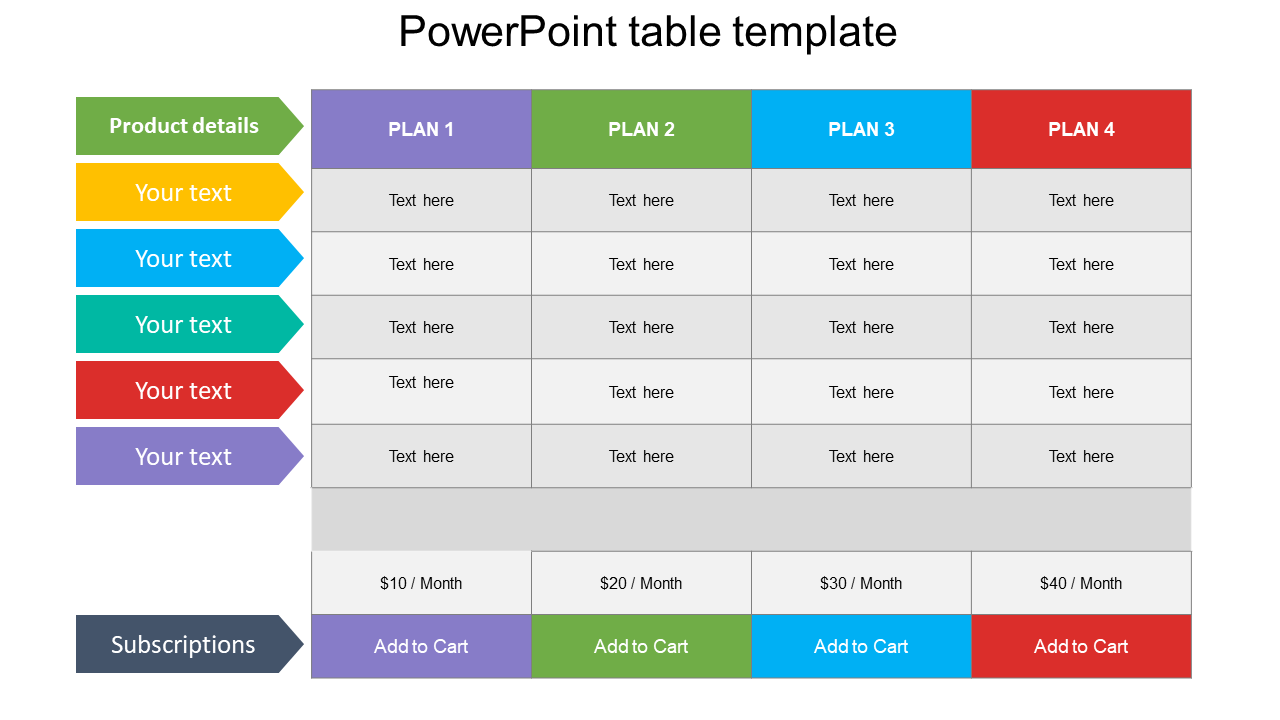
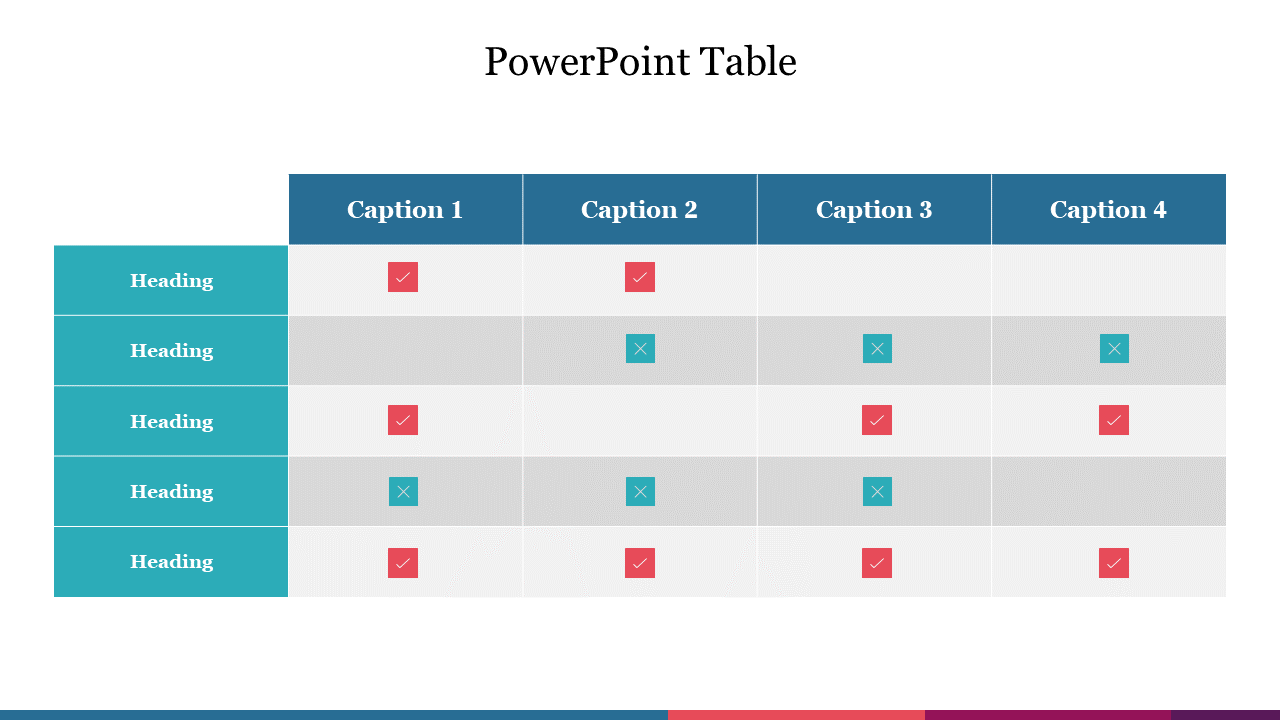
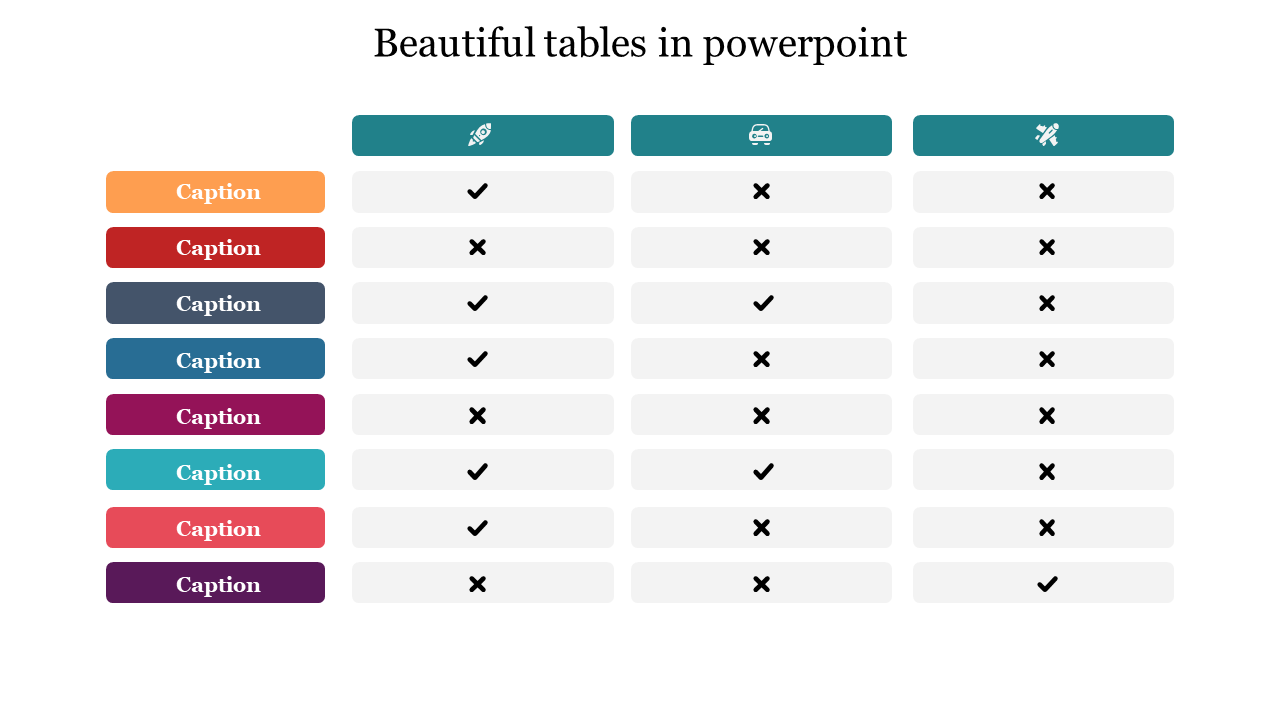
What You Can Create With SlideEgg Table Presentation Templates
Table presentation templates are not only for finance or data-heavy teams. They are useful whenever you need to organize names, dates, status updates, prices, metrics, tasks, or lists in a structured way.
A clear table slide helps your audience scan information faster and understand the main points without reading long paragraphs. You can use these layouts for reports, pricing comparisons, dashboards, meeting summaries, project tracking, and business planning slides.
Comparison Table Templates
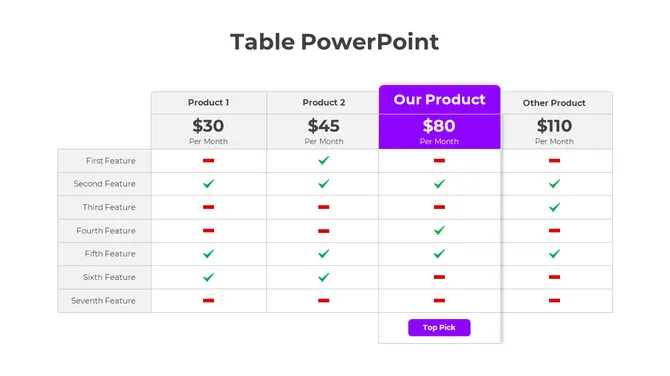
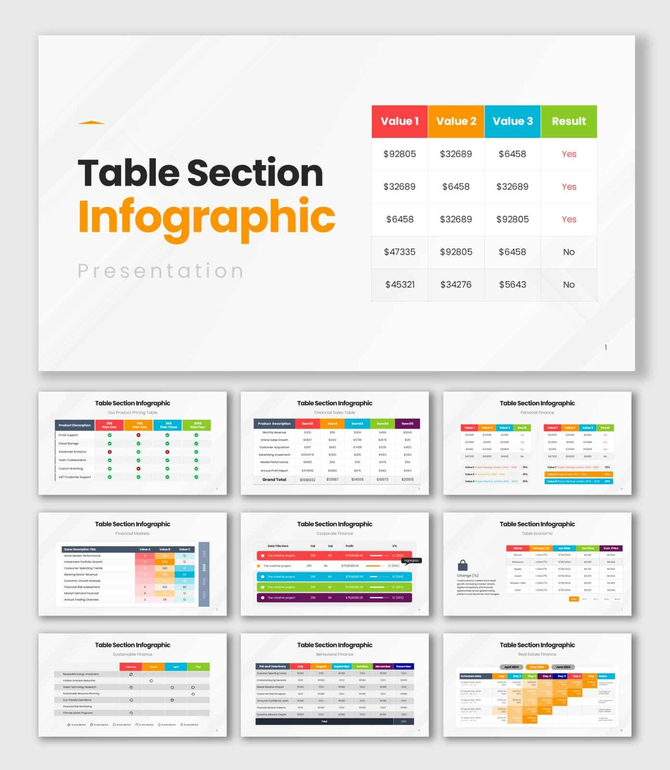
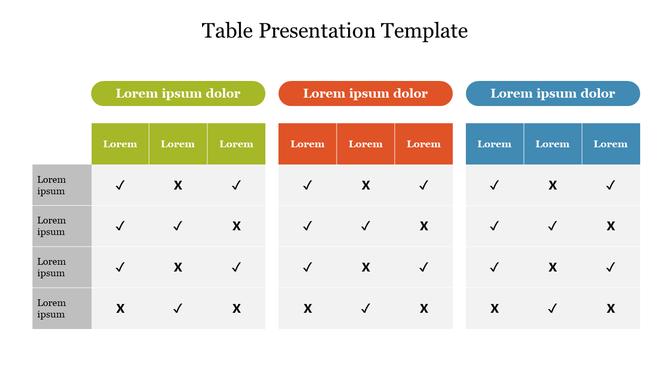
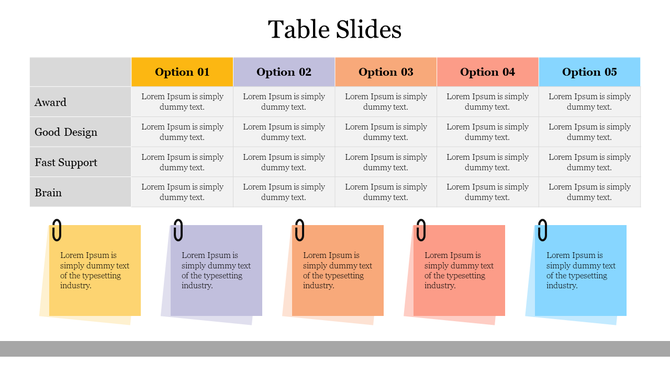
Comparison table templates help you compare products, services, vendors, tools, features, and options side by side. They make it easier for viewers to scan rows, check differences, and understand which option fits their needs.
Pricing Table Templates
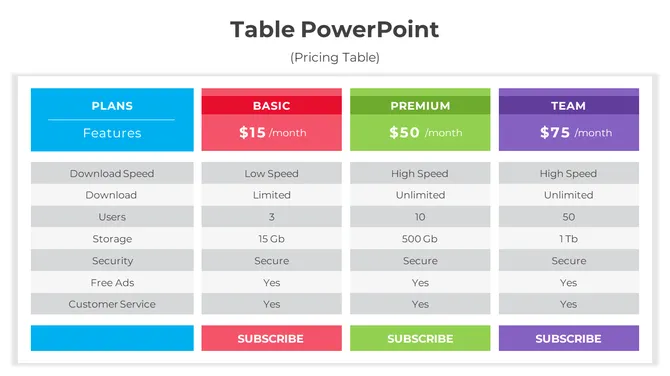
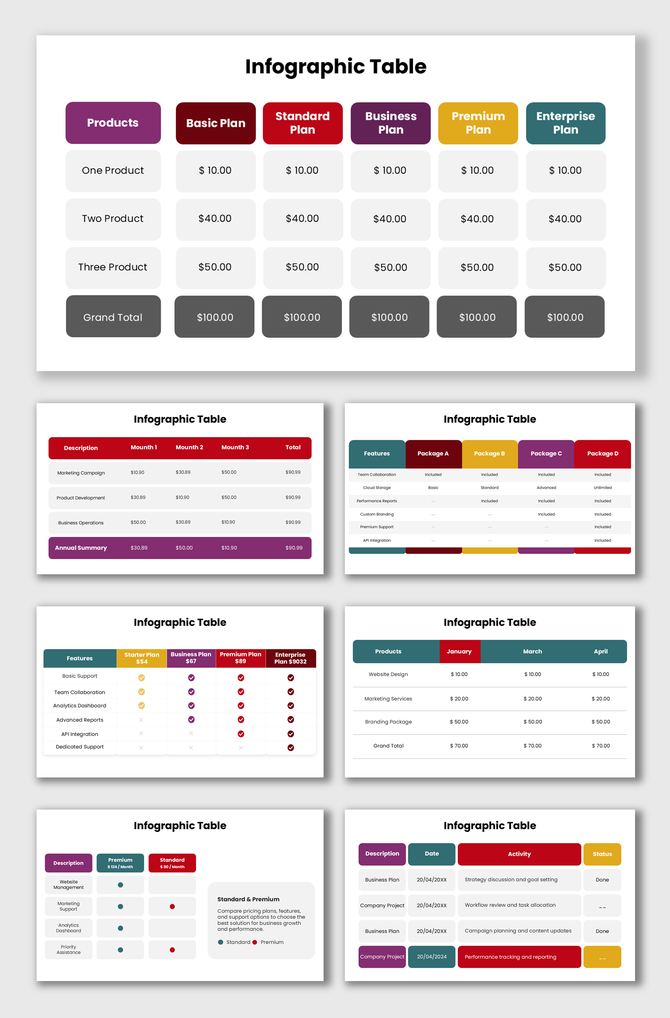
Pricing table templates help you present plans, packages, features, add-ons, limits, and cost differences clearly. They are useful for sales decks, product presentations, service proposals, SaaS pricing slides, and subscription plan comparisons.
KPI and Metrics Table Slides
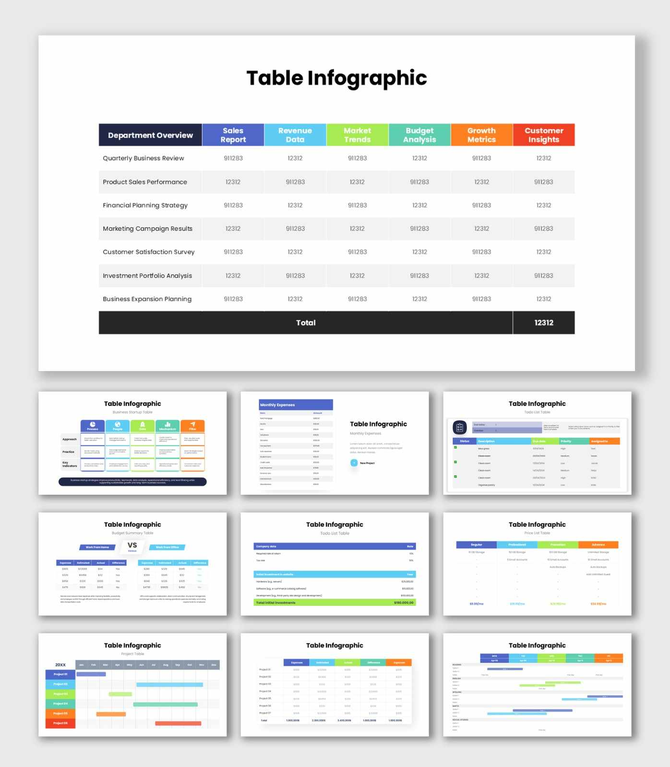
KPI and metrics table slides are useful for showing targets, actual results, progress status, department metrics, and performance summaries. They help managers, analysts, and business teams present important numbers in a readable slide layout.
Project Status Table Templates
Project status table templates help teams track tasks, owners, deadlines, priorities, risks, and progress. Use them for project updates, team meetings, client reports, sprint reviews, and internal planning presentations.
Budget and Expense Table Slides
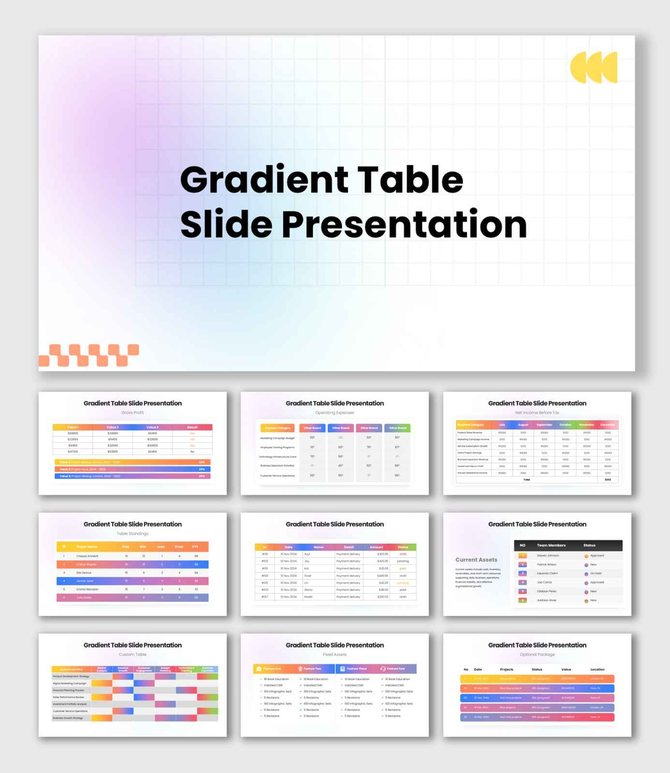
Budget and expense table slides help you show cost categories, planned spending, actual spending, forecasts, and financial summaries. They make financial information easier to present than crowded spreadsheet screenshots.
Schedule and Tracker Table Templates
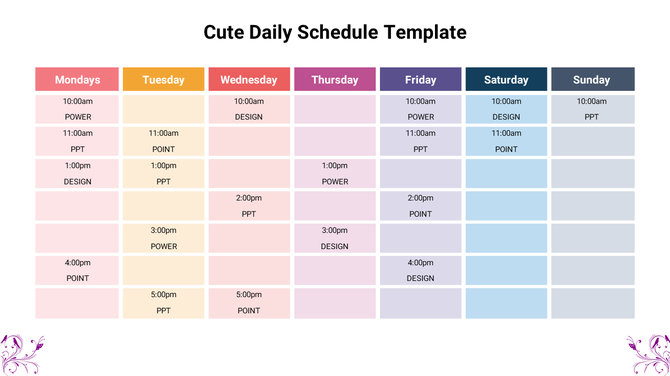
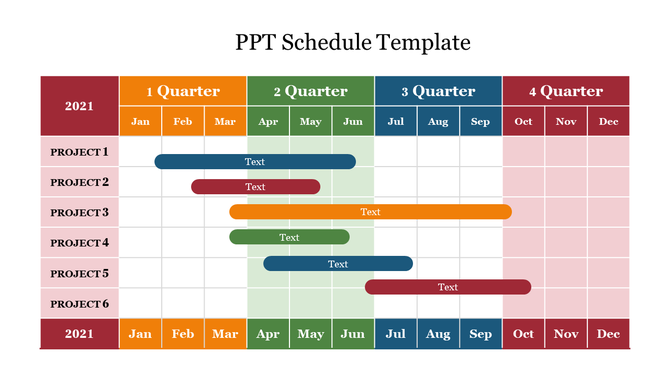
Schedule and tracker table templates are useful for weekly plans, training schedules, task trackers, content calendars, attendance logs, and event plans. They help teams display dates, activities, responsibilities, and timelines in an organized slide layout.
Meeting Summary Table Slides
Meeting summary table slides help you present key decisions, action items, owners, risks, next steps, and due dates after a discussion. They are useful for keeping meetings clear, accountable, and easy to follow.
Who Can Use These Table PPT Templates?
Table slides help anyone who needs to explain structured information clearly. These templates are useful for business teams, sales teams, marketers, HR teams, operations teams, students, teachers, analysts, and researchers.
- Business Teams: Business teams can use table slides in reports, meetings, proposals, and performance reviews. They are useful for KPI dashboards, progress updates, monthly summaries, and department performance tracking.
- Sales and Marketing Teams: Sales and marketing teams can use table slides to compare packages, pricing plans, product features, campaign results, and service options. A clean table makes offers easier to understand and reduces confusion about what is included in each plan.
- HR and Operations Teams: HR teams can use table templates for policies, onboarding plans, training schedules, employee records, and attendance tracking. Operations teams can use them for task assignments, process checklists, shift plans, and workflow updates.
- Students and Teachers: Students can use table slides to show survey results, compare topics, summarize research, and organize project details. Teachers can use them to present lesson plans, class schedules, assessment details, and structured learning content.
- Analysts and Researchers: Analysts and researchers can use table layouts to present findings, comparisons, metrics, and study summaries in a readable format. These templates help turn detailed information into organized slides that are easier to review.
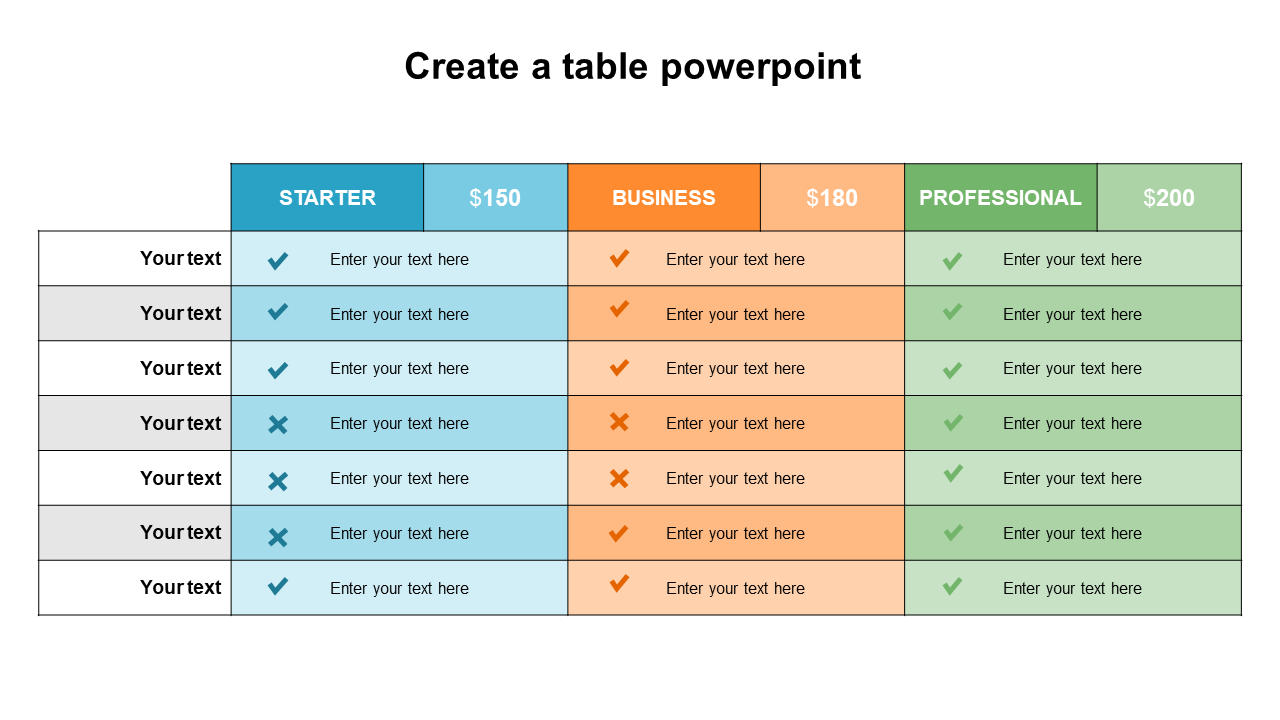
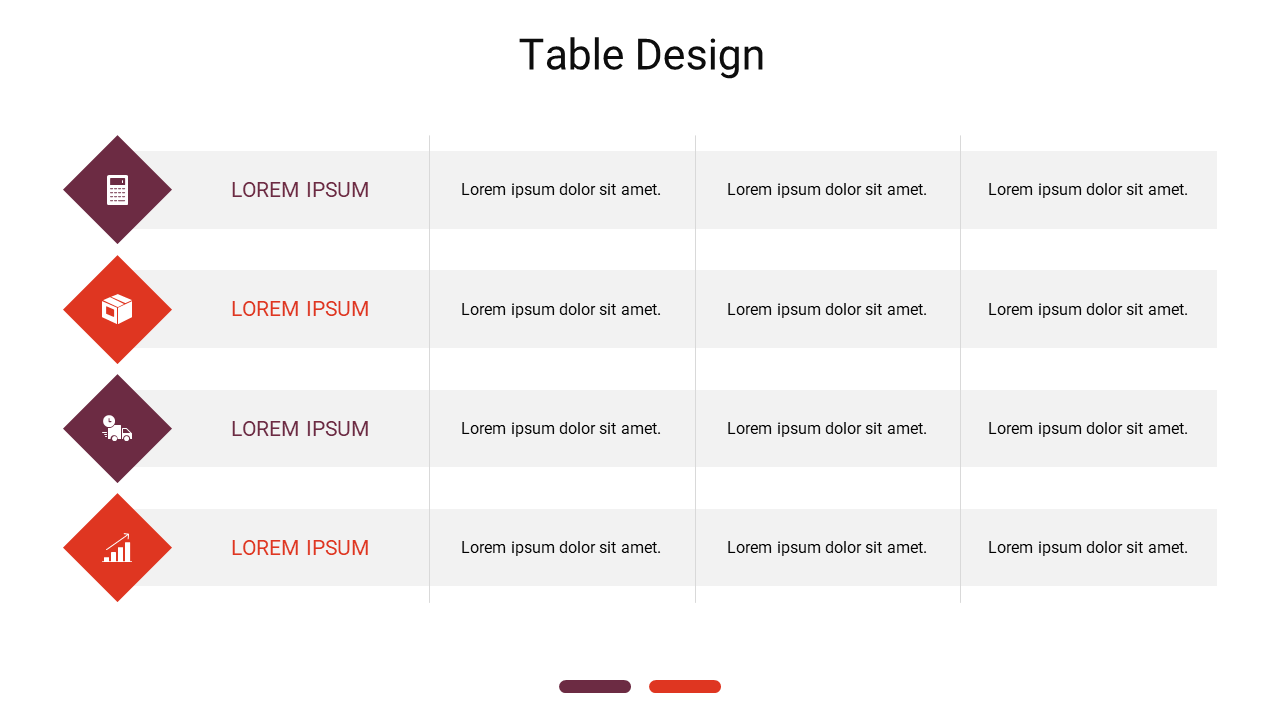
What Makes SlideEgg Table Templates User-Friendly
Here’s what you can edit and use:
- Fully editable text, numbers, colors, fonts, icons, and shapes
- Simple row and column layouts for adding or removing content
- Clean header styles that guide the viewer’s attention
- Highlight options for key values, totals, prices, or recommended plans
- Flexible layouts for pricing, KPI reports, dashboards, schedules, and comparisons
- Presentation-ready designs that look clean on screen and in PDF exports
Tips to Make Table Slides Look Clear and Professional
- Keep headings short and specific
- Limit tables to 3 to 5 columns when possible
- Use one row style for regular data and another style for totals or key points
- Highlight only the most important values
- Split large tables into two slides instead of forcing everything into one layout
- Add a short title that explains why the table matters
-
Avoid long sentences inside table cells
These small changes make your presentation look lighter, clearer, and more professional.
Create Clear Table Slides for Reports, Comparisons, and Dashboards
A table slide should help your audience understand information faster. The right layout makes numbers, options, updates, and decisions easier to compare and explain. That is the main purpose of SlideEgg’s table presentation templates.
If you regularly create reports, proposals, comparisons, dashboards, or planning decks, these editable table templates can save time and improve clarity. Choose a layout, add your content, customize the design, and create presentation-ready data slides in minutes.
Frequently Asked Questions
Are these table templates editable in PowerPoint?
Yes. You can edit the text, numbers, fonts, colors, rows, columns, icons, and shapes in PowerPoint.
Can I use these templates in Google Slides?
Yes. You can select the Google Slides option from the download menu and open a copy of the template directly in Google Slides for editing.
Can I compare plans and costs using these templates?
Yes. Many table designs are made for pricing comparisons. You can show plans, features, limits, add-ons, and cost differences in one clean layout.
Are these templates good for business reports and dashboards?
Yes. They are useful for KPI reports, weekly updates, project status reviews, business dashboards, and performance summaries.
How do I create a custom table style in PowerPoint?
Create a table, apply your preferred fonts, colors, borders, and spacing, then save it in your Slide Master or reuse it as part of a presentation template.
How do I insert a table in PowerPoint?
Go to Insert > Table, choose the number of rows and columns, and add your data. To save time, you can also use a ready-made table template and replace the sample content.
How do table slides improve presentations?
Table slides help organize information into rows and columns, making data easier to compare and understand. They reduce clutter and help the audience find important details quickly.
What types of table templates does SlideEgg offer?
SlideEgg offers table templates for pricing comparisons, KPI reports, project status updates, feature comparisons, schedules, meeting summaries, dashboards, and data reports.
How can table presentation templates help with pricing plan slides?
Table presentation templates help you show pricing tiers, package features, add-ons, limits, and cost differences in one clean layout. This makes it easier for viewers to compare plans without reading long text blocks.
Which table template is best for comparing product features?
Use a comparison table layout with feature names in the first column and product or plan names across the top row. This format works well for product comparisons, SaaS plans, vendor selection, and service package breakdowns.