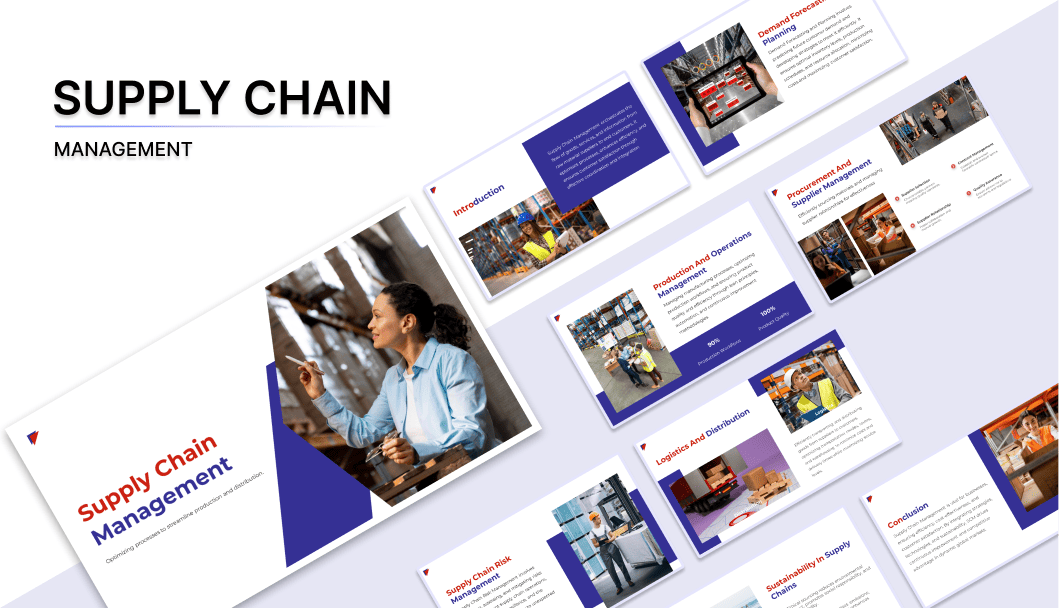
500+ Supply Chain Management Presentation Templates

Supply chains slow down somewhere. Procurement delays? Manufacturing hold-ups? Logistics bottlenecks? Templates let you visualize your entire flow so you and stakeholders can spot inefficiencies fast.
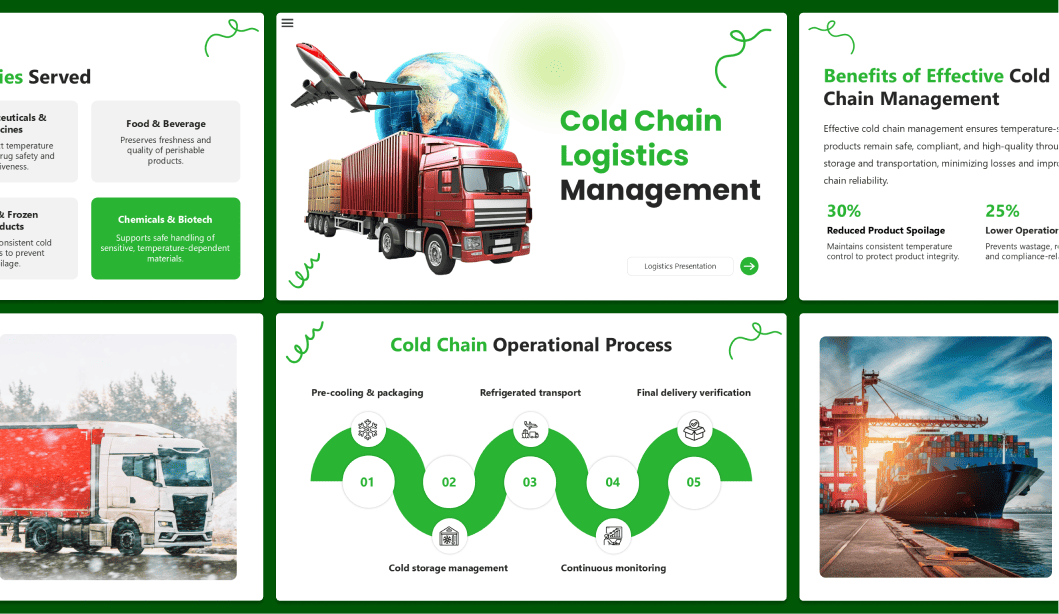
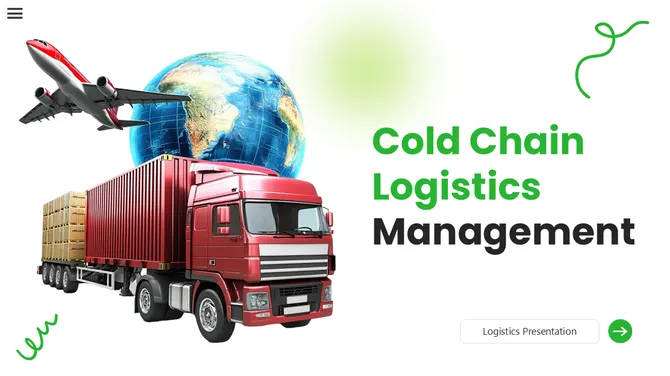
Got a Unique Idea? Craft with AI
PRO
Credits left : 0
Free
Add to Wishlist
Download
AI Customize
Infographic illustrating the five key steps in the supply chain with minimal icons and connecting arrows.
Free
Add to Wishlist
Download
AI Customize
Value chain analysis slide featuring colored arrows labeled with different business functions with text area.
Add to Wishlist
Download
AI Customize
Four vertical arrows in green, orange, blue, and yellow display icons, connected by a line representing a supply chain.
Add to Wishlist
Download
AI Customize
Four-step value chain analysis slide featuring procurement, technology, resources, and infrastructure sections with icons.
Add to Wishlist
Download
AI Customize
Five connected circles in red, orange, blue, green, and purple, representing supply chain stages, with text inside.
Free
Add to Wishlist
Download
AI Customize
Slide displaying a value chain analysis with many colorful sections.
Add to Wishlist
Download
AI Customize
Value chain analysis diagram showing support activities like HR, tech, and procurement influencing logistics and marketing.
Add to Wishlist
Download
AI Customize
Supply chain slide with five colored circles for supplier to customer, each connected to text boxes explaining content.
Add to Wishlist
Download
AI Customize
A vertical list of seven supply chain management goals in various colors, alongside a large icon of a truck and factory.
Add to Wishlist
Download
AI Customize
Supply chain management process slide is illustrated with five steps and color coded icons and placeholder text.
Add to Wishlist
Download
AI Customize
Horizontal supply chain model with five colored curved paths, each leading to icons and text.
Add to Wishlist
Download
AI Customize
Seven numbered circular icons connected horizontally with vibrant colors, representing different stages of the supply chain.
Add to Wishlist
Download
AI Customize
Infographics Supply Chain Diagram Presentation Slide
Add to Wishlist
Download
AI Customize
Circular steps in blue, green, orange, and red with Zara supply chain icons connected by grey curved lines.
Free
Add to Wishlist
Download
AI Customize
A slide showing four interconnected boxes representing supply chain strategies, each with an icon and method description.
Add to Wishlist
Download
AI Customize
Five-step supply chain model showing flow stages like transport and marketing from suppliers to customers.
Free
Add to Wishlist
Download
AI Customize
A value chain slide displaying primary and support activities in a colorful arrow diagram with placeholder text.
Add to Wishlist
Download
AI Customize
Supply Chain PowerPoint Template Free Download slides
Add to Wishlist
Download
AI Customize
Supplier relation management graphic with six icons arranged in a circle around a central human figure and placeholder text.
Add to Wishlist
Download
AI Customize
Value Curve analysis slide with sections for procurement, technology, resources, and infrastructure each with colorful icons.

Related Collections

Frequently Asked Questions

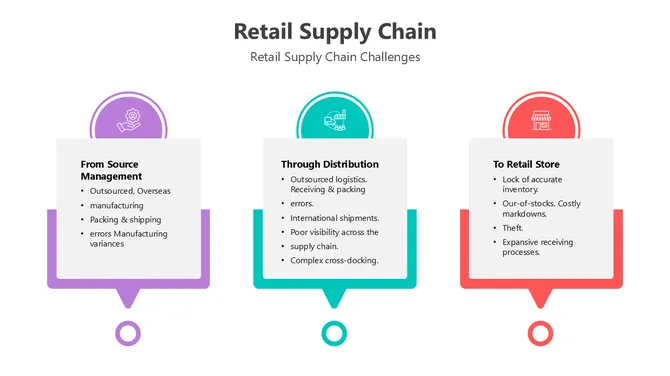
1. How do I identify bottlenecks in my supply chain?

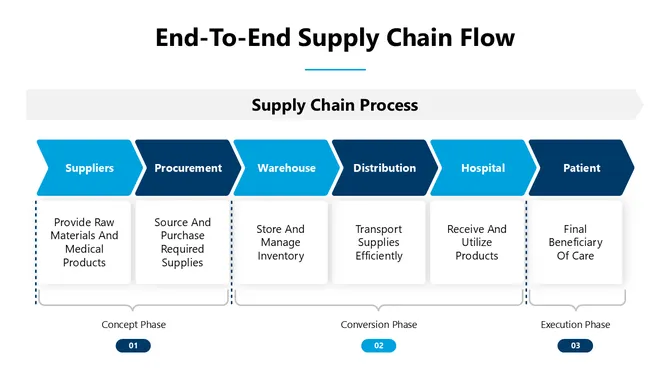
Map your entire process from procurement to delivery. Look for stages where materials pile up, wait times increase, or handoffs slow things down. Templates provide the visual framework to spot these problem areas quickly.

2. How do I present supply chain risks and vulnerabilities to stakeholders?

Identify single points of failure — suppliers you depend on heavily, locations at risk, or processes with no backup. Show the impact if each fails. Templates help you visualize dependencies so leadership understands vulnerability.

3. What supply chain metrics should I include in my presentation to show cost efficiency?

Include per-unit cost, total logistics spend, waste percentage, and cost per delivery. Compare current costs to targets or competitors. Templates organize these metrics so stakeholders see where money is being spent and where savings are possible.

4. How do I present supplier compliance and quality standards in my presentation?

List your compliance requirements, then show how each supplier meets them. Use visual indicators (checkmarks, ratings, certifications). Templates structure this so leadership and auditors quickly see compliance status.

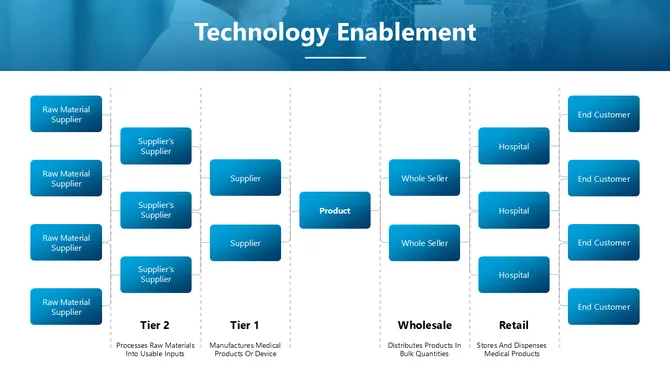
5. How do I visualize my multi-tier supplier network in a presentation?

Show Tier 1 suppliers, then their suppliers (Tier 2), then sub-suppliers (Tier 3). Use hierarchy diagrams or flow charts. Templates make complex supplier networks easy to understand so stakeholders see dependencies and risks.

6. How do I present my supply chain sustainability or ethical sourcing initiatives?

Show which suppliers meet environmental standards, labor practices, or carbon reduction goals. Use metrics like "% of suppliers certified sustainable" or "carbon reduction achieved." Templates help you tell the sustainability story clearly.

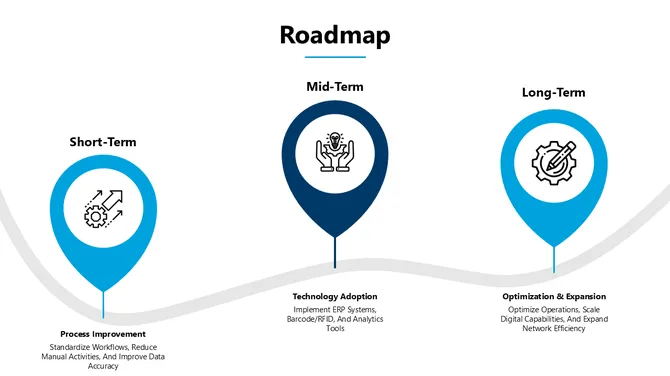
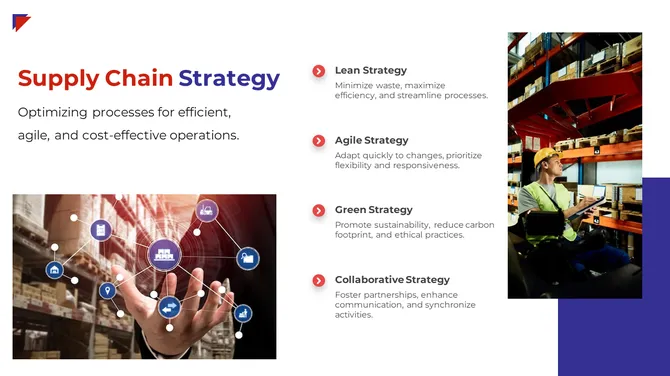
7. What should I include when presenting supply chain optimization or transformation projects?

Show the current state, the problem being solved, the proposed changes, expected outcomes (cost savings, time reduction, risk mitigation), and timeline. Templates provide structure so stakeholders understand the full business case.