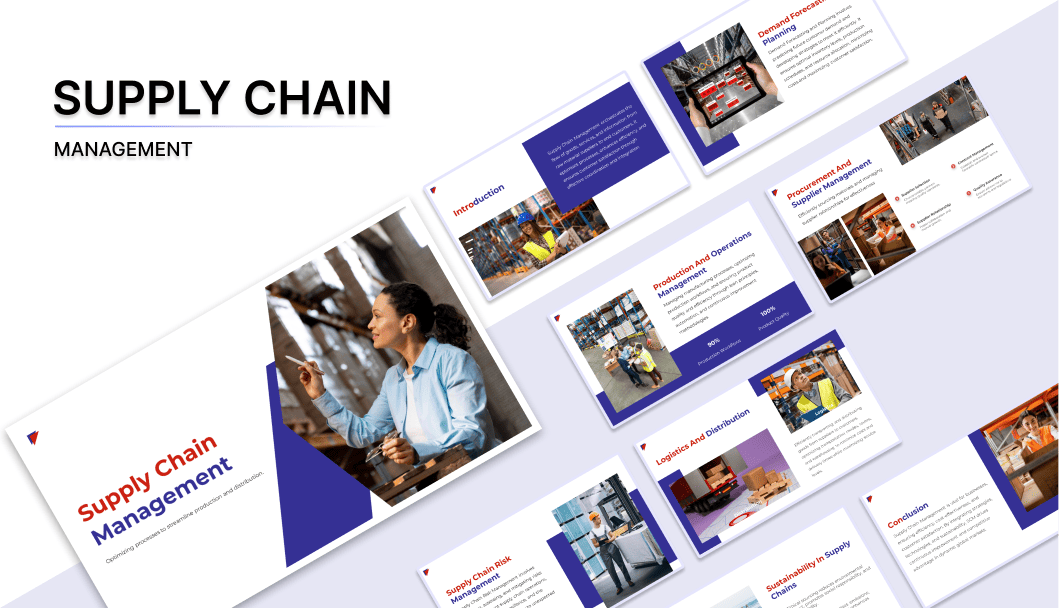
500+ Supply Chain Management Presentation Templates
Supply chains slow down somewhere. Procurement delays? Manufacturing hold-ups? Logistics bottlenecks? Templates let you visualize your entire flow so you and stakeholders can spot inefficiencies fast.
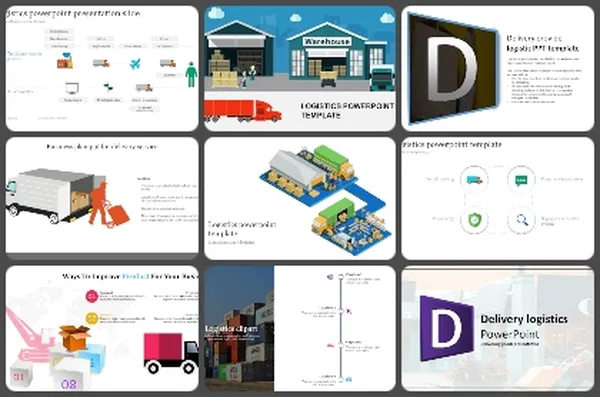
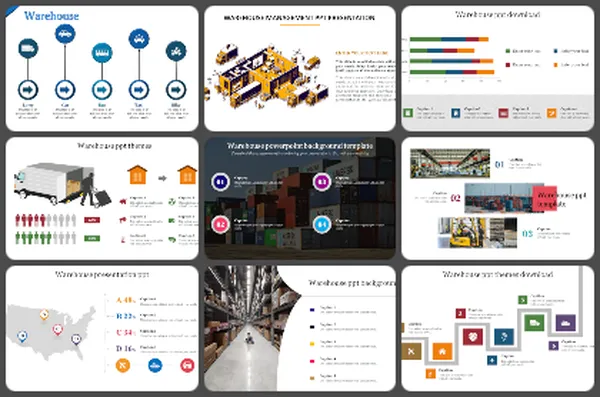
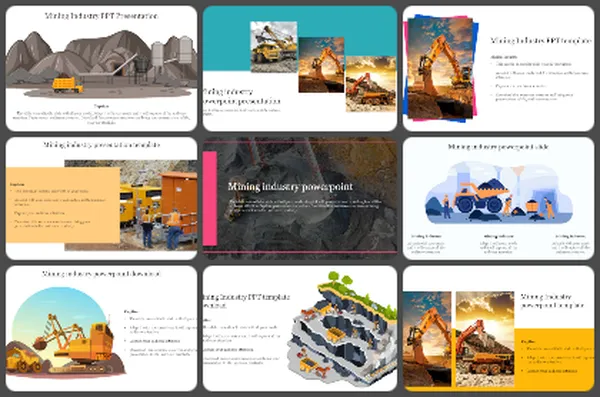
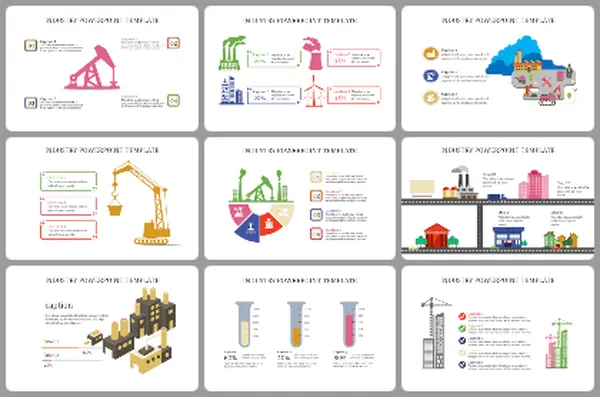
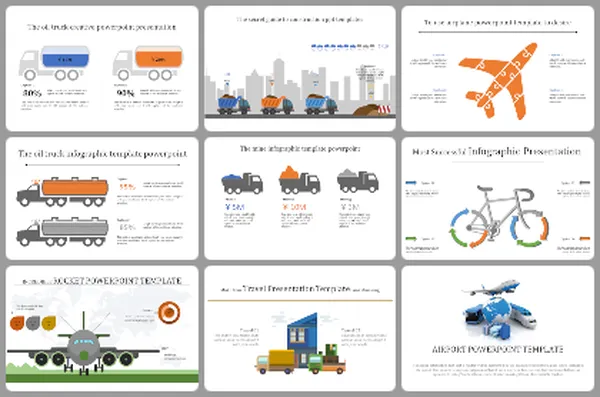
Editor's Choice (1 of5)


- Get everyone excited: Show cool pictures and charts to impress bosses and teammates.
- Work together like friends: Explain even tricky things in supply chain management with simple pictures so everyone understands.
- Think of new ideas: Play with numbers and pictures to find smart ways to improve things.
- Remember more stuff: Learn better when things are fun and colorful.
- Editable multicolor infographics: Creative graphics and icons help explain everything clearly and make your points shine.
- Royalty-free, 100% editable templates: Customize them for your needs, making them uniquely yours.
- Multiple formats and orientations: Whether you prefer widescreen or classic, portrait or landscape, we've slides here.
- Supply chain PPT free downloads: Try before you buy and experience the quality and flexibility.
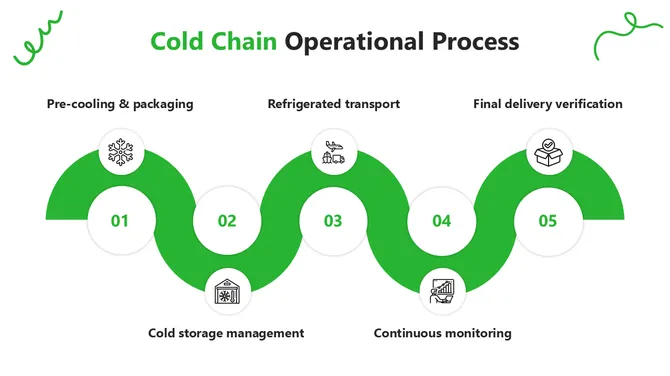
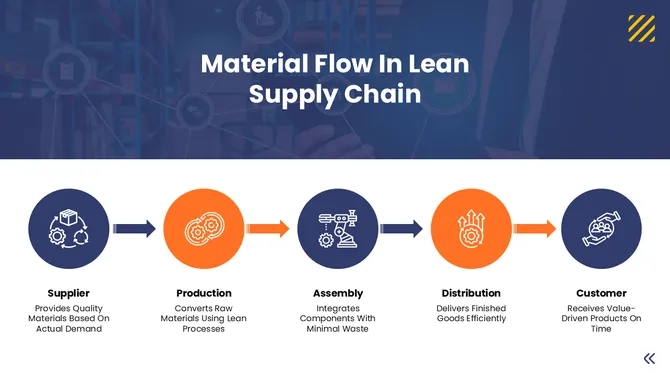
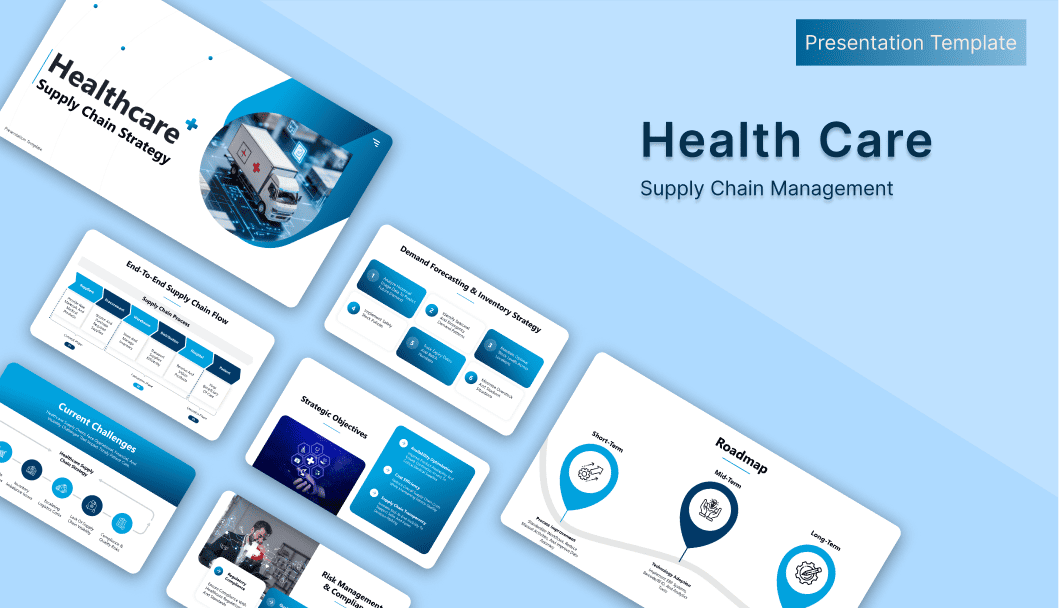
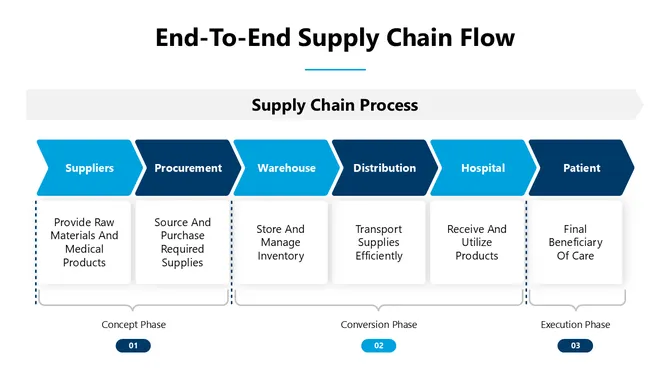
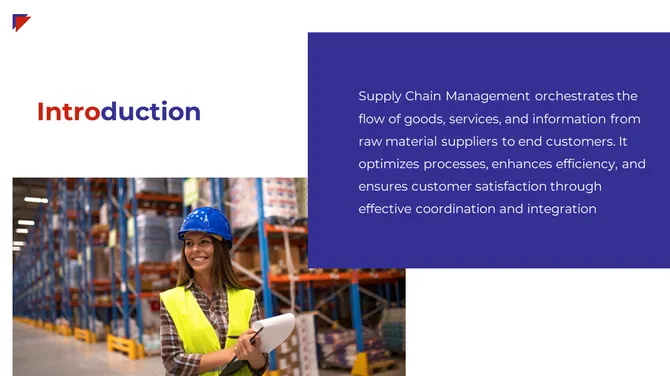
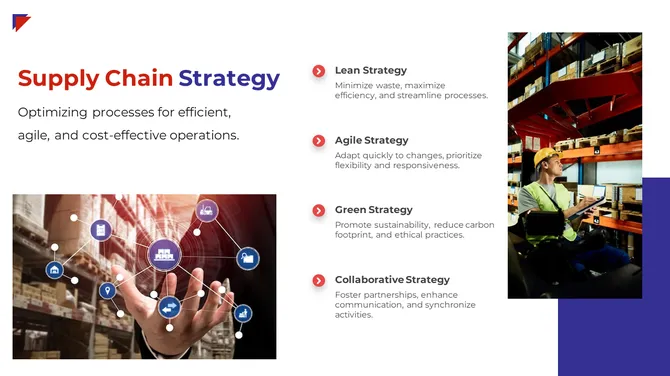
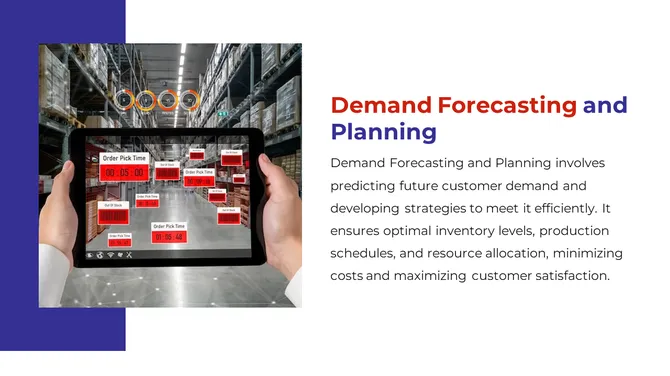
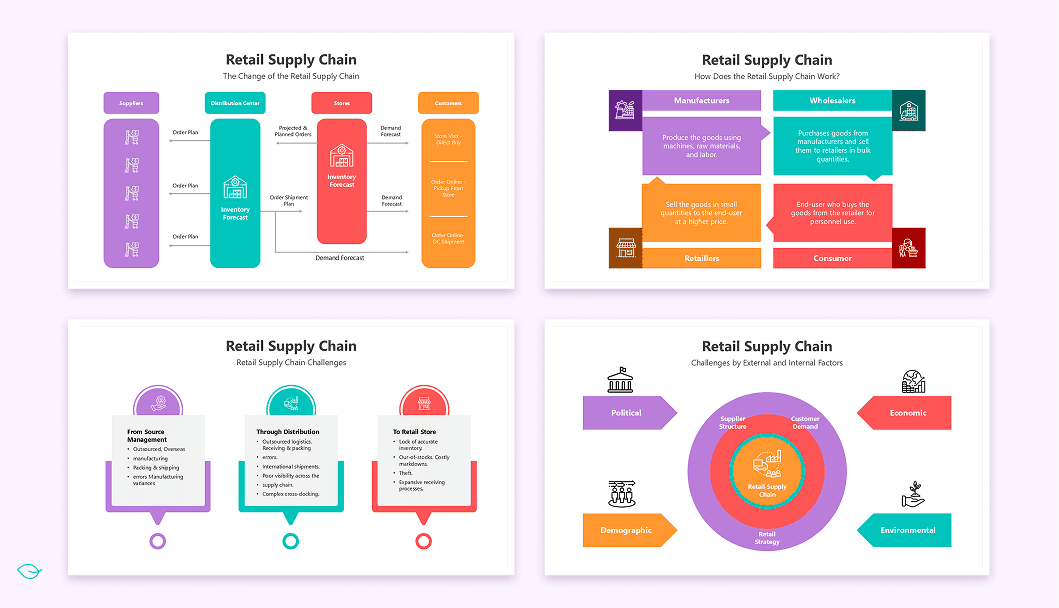
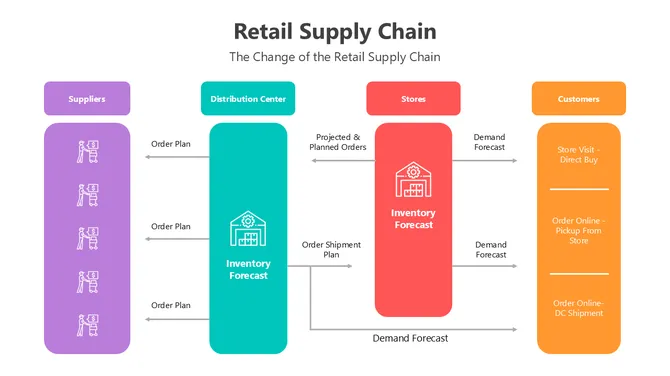
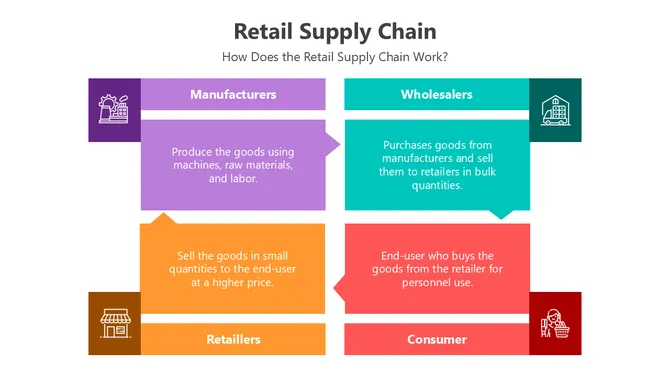
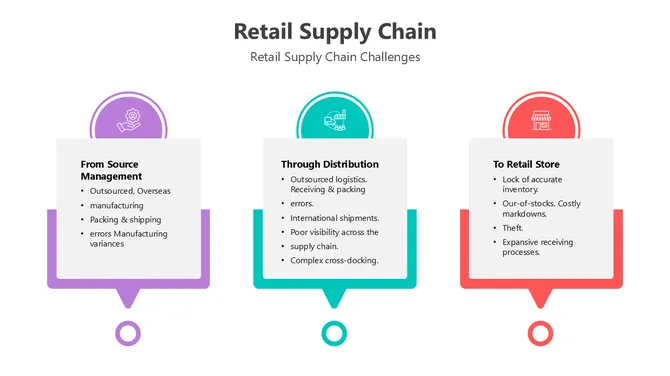
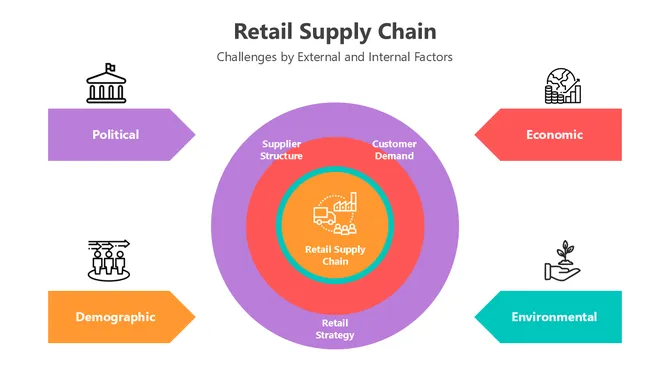
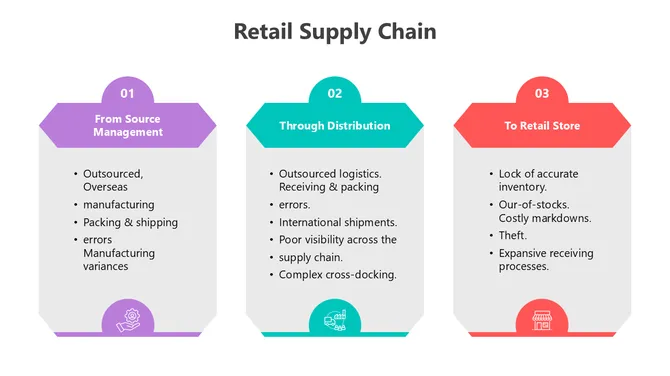
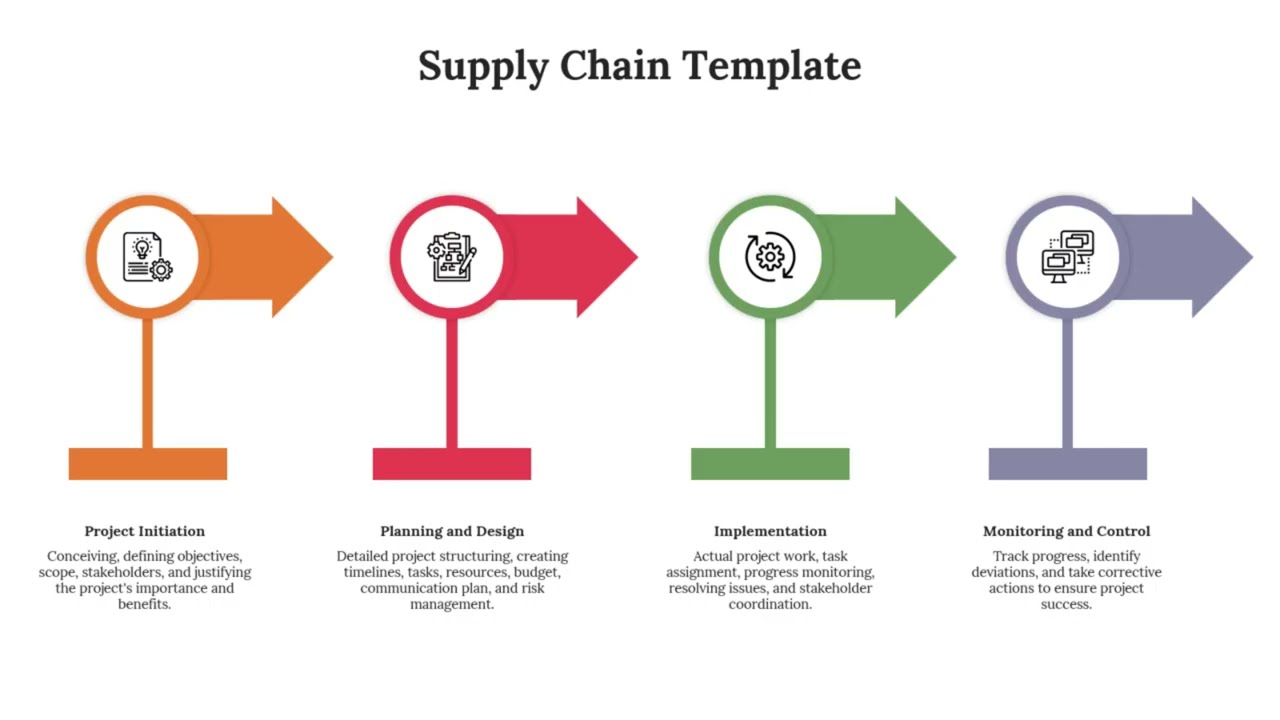
- Process Design: Visualize the supply chain processes with flowcharts and timelines.
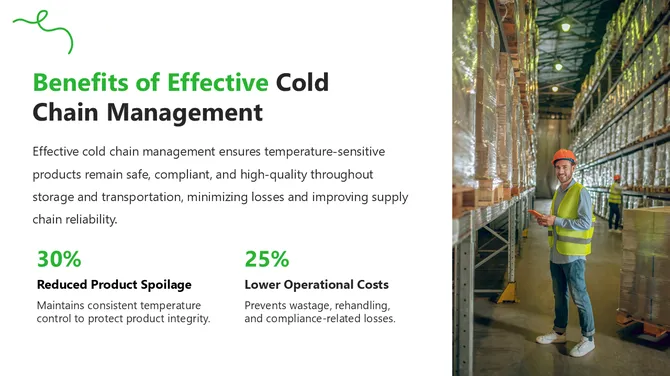
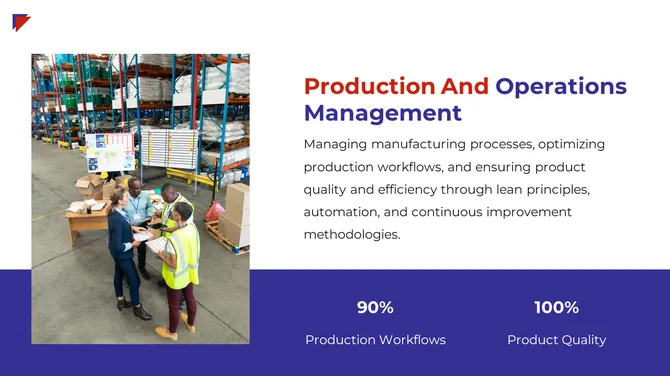
- Optimization Strategies: Showcase cost-saving initiatives and efficiency gains with impactful charts and graphs.
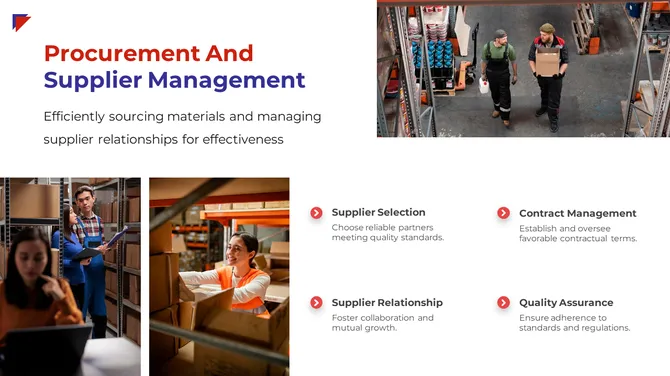
- Supplier Quality Management: Build trust and transparency with data-driven dashboards and scorecards.
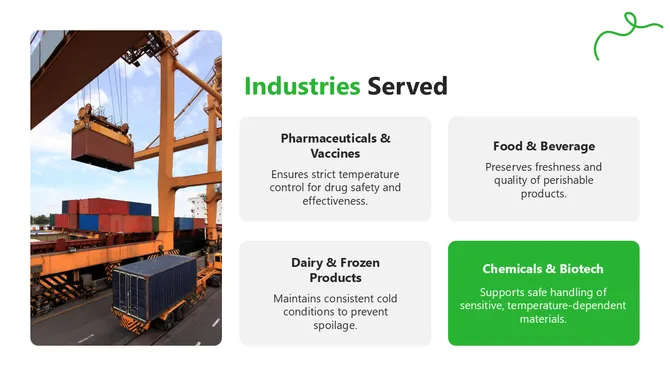
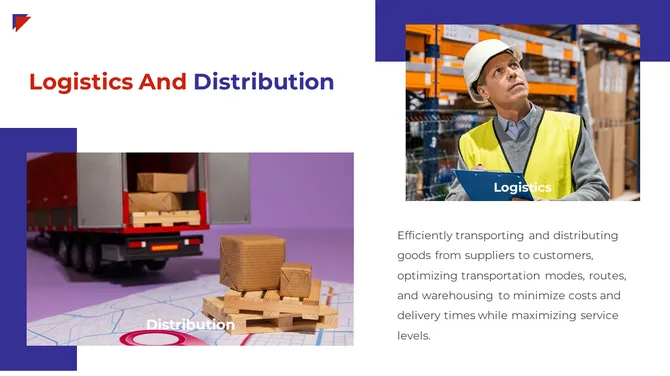
- Logistics & Reverse Supply Chain: Track the journey of your goods, both forward and backward, with maps and timelines.
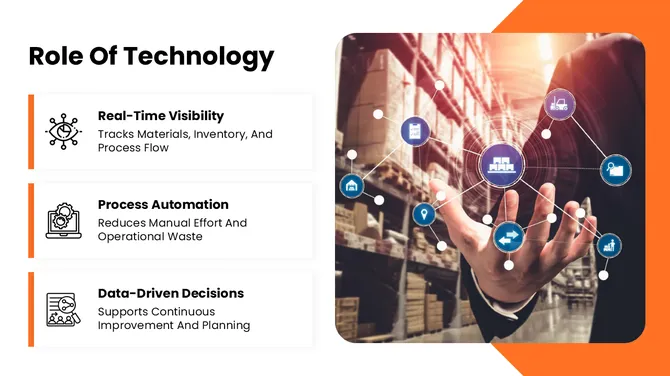
- Digitization & Emerging Trends: Embrace the future of SCM with cutting-edge infographics and illustrations.
Related Collections
Become an expert with SlideEgg

Frequently Asked Questions
1. How do I identify bottlenecks in my supply chain?
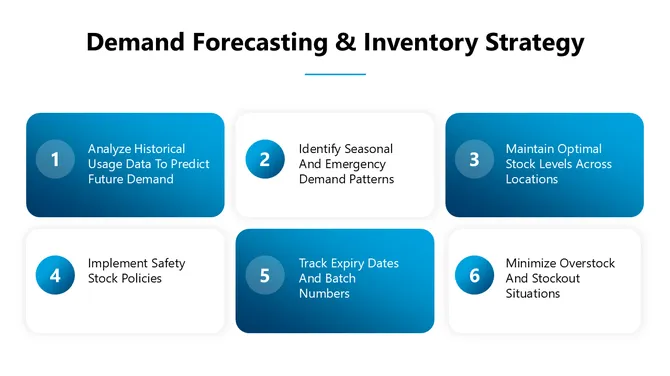
Map your entire process from procurement to delivery. Look for stages where materials pile up, wait times increase, or handoffs slow things down. Templates provide the visual framework to spot these problem areas quickly.
2. How do I present supply chain risks and vulnerabilities to stakeholders?
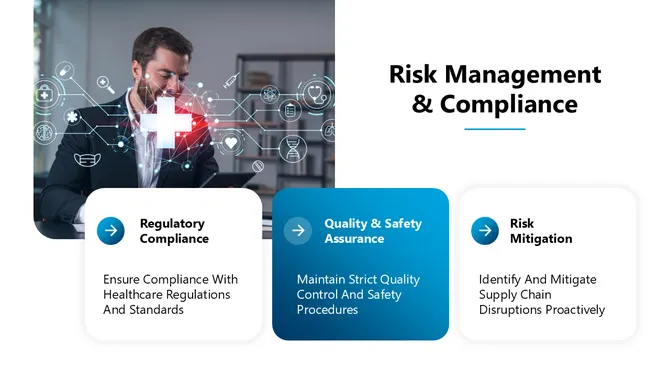
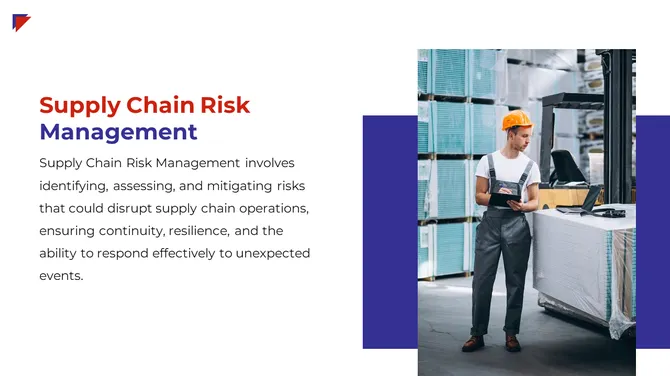
Identify single points of failure — suppliers you depend on heavily, locations at risk, or processes with no backup. Show the impact if each fails. Templates help you visualize dependencies so leadership understands vulnerability.
3. What supply chain metrics should I include in my presentation to show cost efficiency?
Include per-unit cost, total logistics spend, waste percentage, and cost per delivery. Compare current costs to targets or competitors. Templates organize these metrics so stakeholders see where money is being spent and where savings are possible.
4. How do I present supplier compliance and quality standards in my presentation?
List your compliance requirements, then show how each supplier meets them. Use visual indicators (checkmarks, ratings, certifications). Templates structure this so leadership and auditors quickly see compliance status.
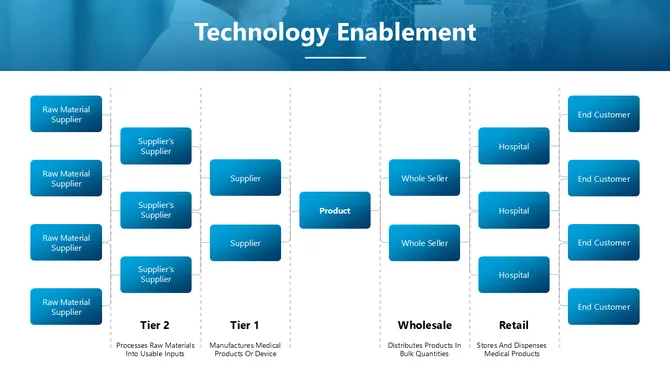
5. How do I visualize my multi-tier supplier network in a presentation?
Show Tier 1 suppliers, then their suppliers (Tier 2), then sub-suppliers (Tier 3). Use hierarchy diagrams or flow charts. Templates make complex supplier networks easy to understand so stakeholders see dependencies and risks.
6. How do I present my supply chain sustainability or ethical sourcing initiatives?
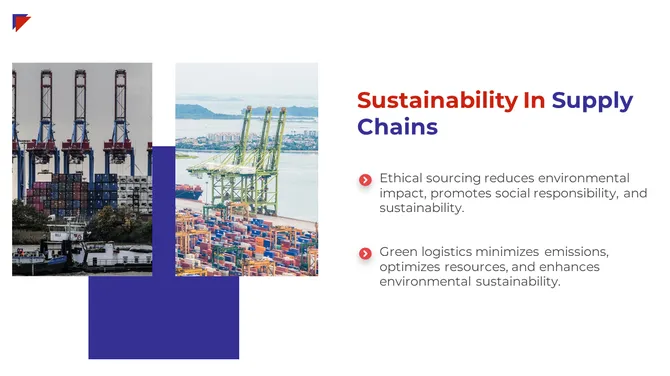
Show which suppliers meet environmental standards, labor practices, or carbon reduction goals. Use metrics like "% of suppliers certified sustainable" or "carbon reduction achieved." Templates help you tell the sustainability story clearly.
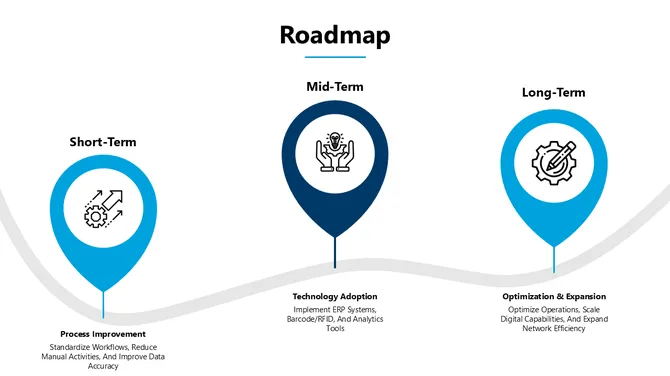
7. What should I include when presenting supply chain optimization or transformation projects?
Show the current state, the problem being solved, the proposed changes, expected outcomes (cost savings, time reduction, risk mitigation), and timeline. Templates provide structure so stakeholders understand the full business case.