Free 2,700+ Infographics PowerPoint Templates
Create engaging presentations with 2,700+ infographic templates for PowerPoint, Google Slides, and Canva. Visualize complex information clearly using editable charts, timelines, and diagrams designed for business, education, marketing, and professional presentations.
Editor's Choice (1 of5)


Do Your Presentations Fall Flat? Make Them Stand Out with Infographics!
What are Infographic Presentation Template?
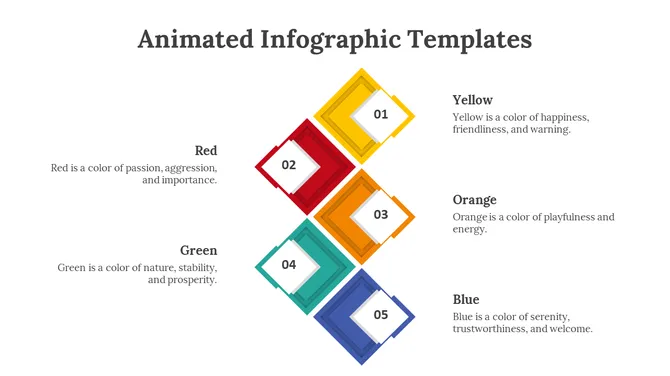
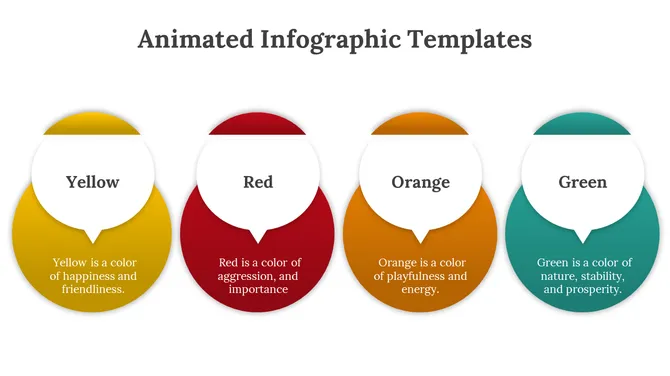
Infographic presentation templates are pre-designed slides that use charts, icons, timelines, diagrams, and visuals to present information in a simple and engaging way. These templates help users explain complex ideas, data, statistics, and processes clearly through visual storytelling.
They are commonly used in business meetings, education, marketing reports, research presentations, and project planning. Infographic templates save time by providing ready-made layouts that are easy to customize in PowerPoint, Google Slides, and Canva.
Timeline Infographic Templates
Show project milestones, business growth, historical events, and step-by-step progress clearly with editable timeline infographic templates for PowerPoint, Google Slides, and Canva.
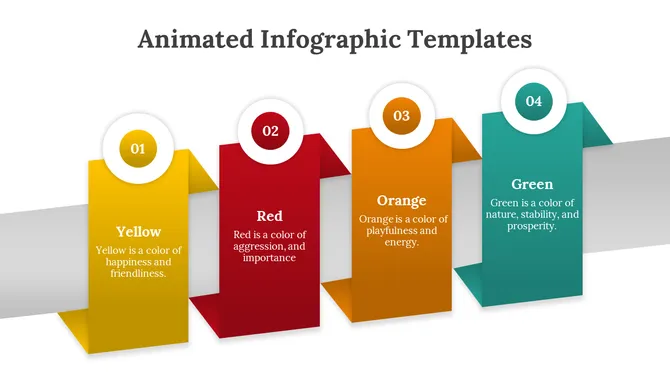
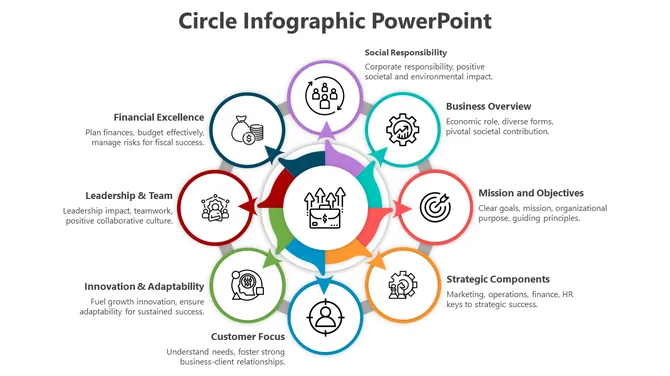
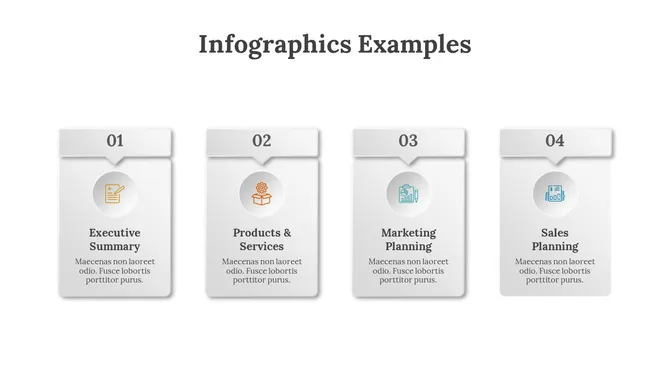
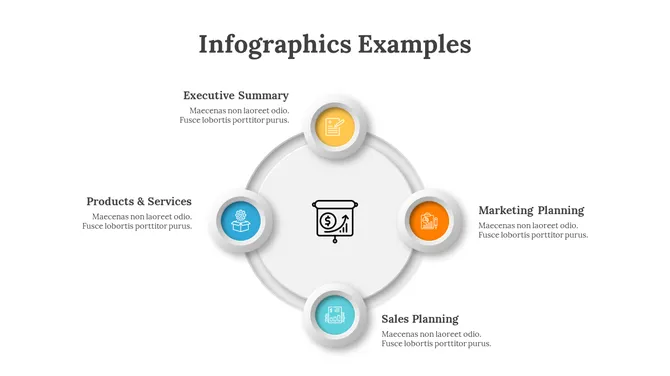
Process Flow Infographic Templates
Explain workflows, business processes, strategies, and operational steps easily using visually engaging process flow infographic presentation templates.
Comparison Infographic Templates
Compare products, services, ideas, features, or business strategies side by side with easy-to-edit comparison infographic presentation slides.
Data Visualization Templates
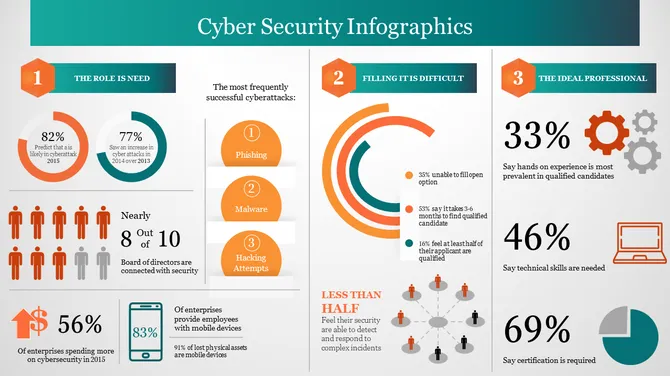
Present statistics, reports, analytics, and research findings effectively with data visualization infographic templates designed for clear communication.
Pyramid Infographic Templates
Illustrate hierarchies, growth stages, priorities, and business structures using creative pyramid infographic presentation templates.
Funnel Infographic Templates
Display sales funnels, marketing stages, customer journeys, and conversion processes clearly with professional funnel infographic templates.
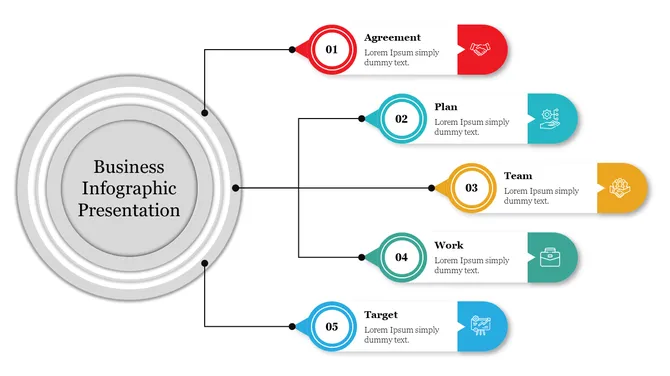
Business Infographic Templates
Create impactful business presentations with infographic templates for strategy planning, marketing analysis, financial reports, and corporate communication.
Education Infographic Templates
Simplify lessons, classroom topics, educational data, and learning concepts with engaging education infographic templates for students and teachers.
Who Can Use an Infographic Presentation Templates?
Why Use Infographics?
Key Benefits of SlideEgg's Infographics Templates
Frequently Asked Questions
How do infographic templates improve presentations?
Infographic templates help present complex information through visuals, charts, and diagrams, making presentations easier to understand, more engaging, and visually appealing for audiences.
Are infographic presentation templates useful for start-ups?
Yes. Start-up's often use infographic templates for pitch decks, investor presentations, marketing strategies, product overviews, and growth reports to communicate ideas professionally.
What is the best way to present my infographic in a presentation?
Get ready for your presentation to go as if there are no obstacles to it by practicing it a few times before showtime. Explain the main ideas of the infographic directly and using concise language.
Why are infographics effective for presentations?
Infographics help people to digest data more quickly, they attract and hold the listeners’ attention, as well as, help in understanding it better. As for comprehension, silver bullets are superior alternatives to words for they imply complex ideas in a digestible manner.
Which infographic templates are commonly used in educational presentations?
Education presentations commonly use process infographics, comparison diagrams, timelines, hierarchy charts, and data visualization templates to simplify learning topics.
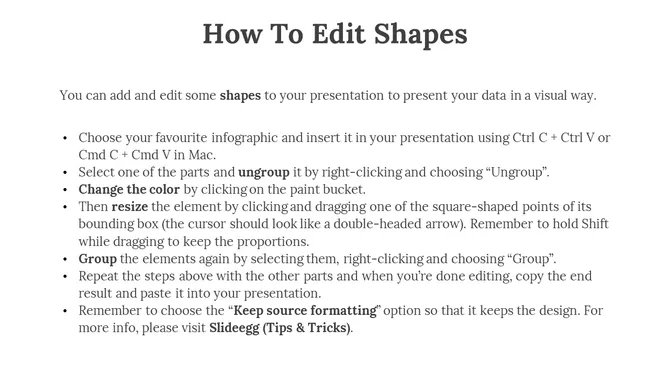
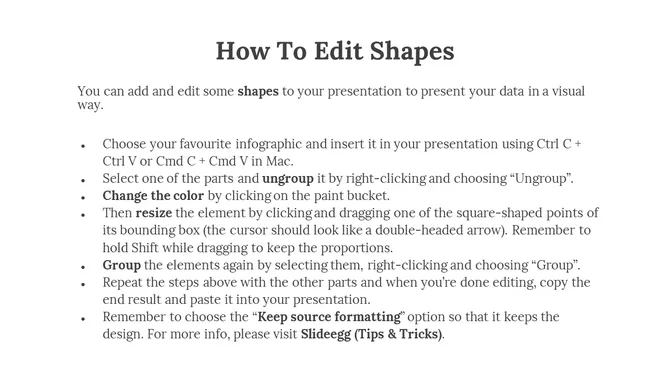
Are the infographic templates customizable?
Yes, you are free to change the text and insert your images together with your branding.
Are the templates compatible with different platforms?
Of course, the slides are available for PowerPoint, Google Slides, and Canva. You just need to be sure that you can get the slide from the source and present it to the audience, no software is needed for them to view the slides.