MILESTONE 🌟 5 Million+ creative minds trust SlideEgg! Grab 80% OFF

Infographic PowerPoint for Visual Data Representation

Four vertical infographic steps in purple, blue, green, and red with circular icons and captions below.
P.ID : 12097
    207 views
    8 Downloads
    Get Custom Slides by Experts
    Instantly Access Templates in PowerPoint

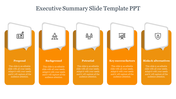
    Creative Infographic PowerPoint Presentation Templates


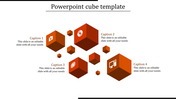
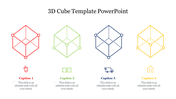
    Be brief and use visuals to keep your audience engaged. This creative infographic PowerPoint template and Google Slides is highly user-friendly and consists of a four-step process infographic with colorful nodes, and there is a lot of room for captions, titles, and explanations. The template is the best fit for marketers, teachers, or anyone who wants to turn the complex data into the interesting visuals. You can use this template to make presentations that will be very attractive for your audience. In contrast to the cumbersome infographic templates, ours is user-friendly and you can tailor it to your content. Do not wait any longer and get this app to turn the difficult data into powerful visuals.

    Features of the template


    • 100% customizable slides and easy to download.
    • The slides contain 16:9 and 4:3 formats.
    • Easy to change the colors quickly.
    • It is a well-crafted template with an instant download facility.
    • It is a 100% pre-designed slide.
    • The slide holds vibrant colors.
    Advertisement

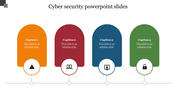
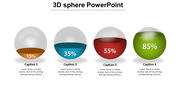
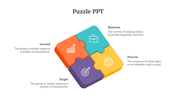
    You May Also Like These PowerPoint Templates

    Add to Wishlist
    Download
    AI Customize
    Green 3D cubes, two of which have icons and captions, arranged in a scattered pattern on a white background.
    Add to Wishlist
    Download
    AI Customize
    Risk matrix with green blocks in varying shades, labeled high, medium, and low, mapping probability against impact.
    Add to Wishlist
    Download
    AI Customize
    Orange and white infographic detailing succession planning stages from identification to review with icons and descriptions.
    Add to Wishlist
    Download
    AI Customize
    Risk matrix chart slide showing impact vs. probability with categories for medium, high, and low risks.
    Add to Wishlist
    Download
    AI Customize
    Mobile app template featuring a gear, mobile device, and phone icon in yellow circles, each linked to caption areas.
    Add to Wishlist
    Download
    AI Customize
    3D orange sphere segmented into four layers, each labeled and shaded differently, with corresponding text on the right.
    Add to Wishlist
    Download
    AI Customize
    Four colored cubes in yellow, teal, purple, and red, labeled 1-4, linked with circles mentioned F, I, F, O and text below.
    Add to Wishlist
    Download
    AI Customize
    Infographic slide with six colored sections in a 3D pie chart, each paired with a caption areas.
    Add to Wishlist
    Download
    AI Customize
    Puzzle style PowerPoint template with four colorful sections and captions.
    Add to Wishlist
    Download
    AI Customize
    Puzzle piece graphic slide featuring four colorful pieces with placeholders for text and descriptions.
    Free
    Add to Wishlist
    Download
    AI Customize
    Marketing plan template showing a four-tier pyramid diagram with numerical labels and related captions areas.
    Free
    Add to Wishlist
    Download
    AI Customize
    3D shape PowerPoint template with four colorful icons and caption areas on each side.
    Add to Wishlist
    Download
    AI Customize
    Dual 3D diagrams with labeled segments, emphasizing a blue middle block on the right with two caption areas.
    Add to Wishlist
    Download
    AI Customize
    Business achievement slide with a pyramid structure representing steps to reach the goal, including icons and captions.
    Free
    Add to Wishlist
    Download
    AI Customize
    Four key marketing strategies are represented with icons cost leadership, differentiation, management, and cost focus.
    Add to Wishlist
    Download
    AI Customize
    Three 3D spheres increasing in size from left to right, showing percentages with titke text on the left.
    Add to Wishlist
    Download
    AI Customize
    A collection of isometric KPI infographic slides showcasing bar graphs, pie charts, and performance metrics with icons.