Free - Coal Supply Chain Infographic PPT And Google Slides
Free

 Canva
Canva

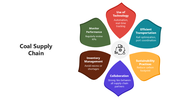
Multicolor Infographics for Coal Supply Chain Presentations
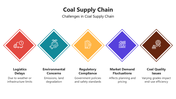
Are you struggling to visualize the specific bottlenecks in your current logistics flow, or do you need a template that lets you mix and match diagrams for ad-hoc stakeholder updates?
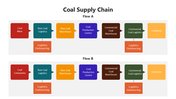
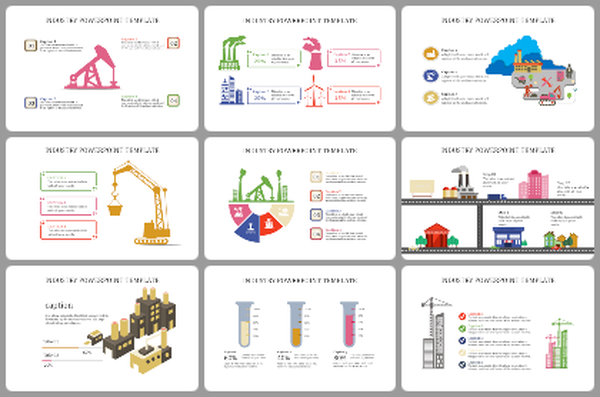
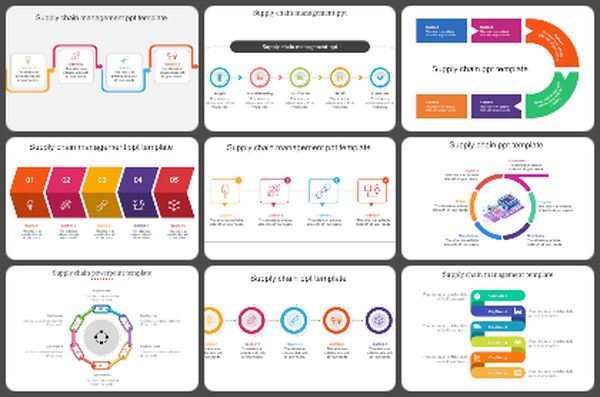
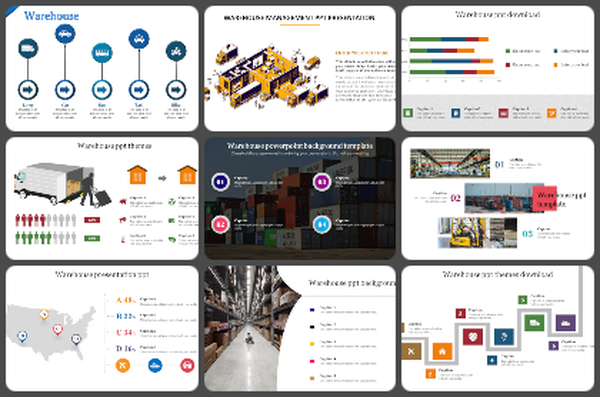
This collection of modular slides provides high-visibility infographics to map coal supply chain operations. Unlike static decks, this set offers individual visual components that you can extract and rearrange to fit your specific logistics reporting requirements.
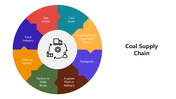
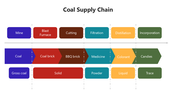
Each slide utilizes a distinct color-coded system to separate extraction, transportation, and distribution data points. You get access to varied infographic styles, including circular process diagrams, node-based flowcharts, and gear-driven models. These layouts allow you to emphasize specific operational stages, such as storage or retail distribution, without being locked into a predefined narrative.
The professional design uses high-contrast colors to ensure data remains legible during team briefings or investor updates. By using these standalone visuals, you build a custom presentation that mirrors your specific supply chain structure. You retain full control over text, icons, and branding to maintain organizational consistency. Use this collection to visually simplify complex logistics and deliver direct, data-backed reports.
Features of this template:
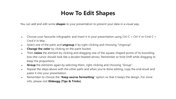
- Easy to edit: Change text, colors, icons, and branding.
- Multi-platform use: Works with PowerPoint, Google Slides, and Canva.
- Screen-ready format: Fits standard presentation screens and projectors.
- Collection of infographic slides: Pick the layout you need.
- Color-coded sections: Separate each supply chain stage clearly.
- Multiple flow styles: Includes circular, linear, and gear-based diagrams.
- Metric-friendly layouts: Add logistics, storage, and performance data easily.
- Clear icons: Identify mining, transport, and industrial areas fast.
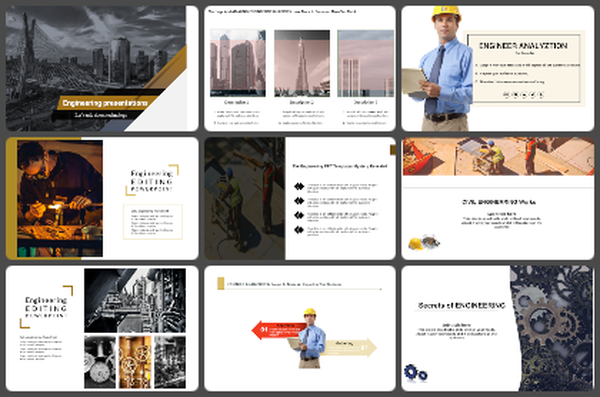
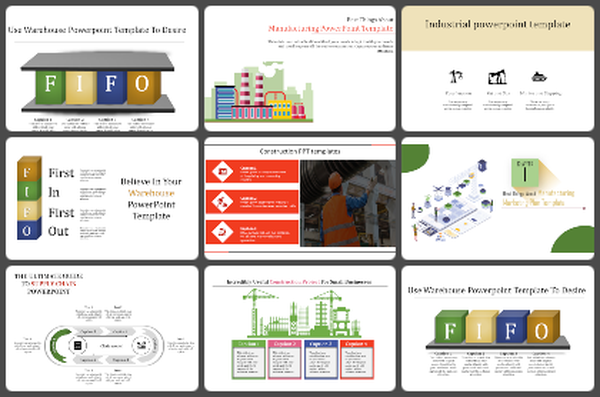
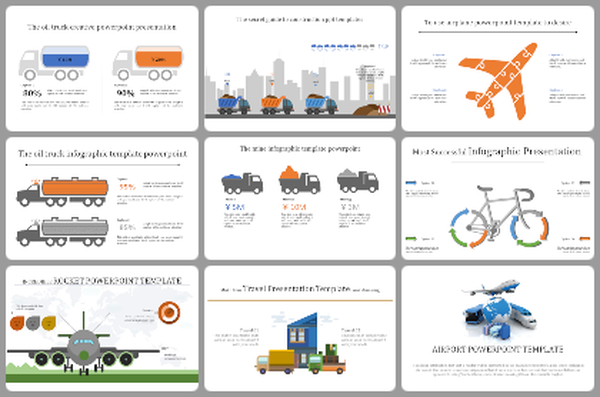

You May Also Like These PowerPoint Templates
Add to Wishlist
Download
AI Customize

Add to Wishlist
Download
AI Customize

Add to Wishlist
Download
AI Customize

Add to Wishlist
Download
AI Customize

Add to Wishlist
Download
AI Customize

Add to Wishlist
Download
AI Customize

Add to Wishlist
Download
AI Customize

Add to Wishlist
Download
AI Customize

Add to Wishlist
Download
AI Customize

Add to Wishlist
Download
AI Customize

Add to Wishlist
Download
AI Customize

Add to Wishlist
Download
AI Customize

Add to Wishlist
Download
AI Customize

Add to Wishlist
Download
AI Customize

Add to Wishlist
Download
AI Customize

Add to Wishlist
Download
AI Customize

Add to Wishlist
Download
AI Customize


Add to Wishlist
Download
AI Customize

Add to Wishlist
Download
AI Customize
