Data is involved in almost all the presentations that take place. The teams use data to discuss figures, make comparisons, monitor progress, and review results in meetings. The problem in 2026 is not having data. The problem is conveying data in a way that allows people to understand it and make better decisions.
Having the right table slide design is important for making it easy to understand the data on the table. The wrong table design can even make simple figures confusing. How to select the right table presentation template is described in this article easily.
Why Table Design is More Important in 2026
People are consumed with information. Meeting times are fixed. The attention time is limited. The audience should be able to understand the message of a table on a slide in a matter of seconds.
A proper table template:
- Allows quick scanning of numbers.
- Brightens value comparison
- Reduces the need for lengthy discussions.
- Position of power—classic and peaceful
Begin with the Purpose of Your Data
Before checking the templates, it is necessary to identify one thing.
What is this table meant to convey or communicate?
Your table could serve the following purposes:
- To compare products or plans
- To show the performance trend
- To present pricing or budgets
- To display results or scores
Knowing the purpose makes it easy to select a format. A table meant for comparison looks different from one used for reporting.
2026 Visual Specifications: Dark Mode Optimization
By 2026, light and soft will be out. High-performance table templates use Dark Mode to reduce eye strain while increasing message level.
- Backgrounds: Use Deep Charcoal to remove brightness from LED walls and modern monitors.
- Contrast: Maintain a 7:1 Contrast Ratio (AA Standard). Use Saffron or Electric Blue only for key data points.
- No disappearing: Avoid light grey borders that vanish on projectors. Use grid lines around for consistent visibility.
- Clean Structure: Keep rows and columns neat with strong alignment—clarity comes from contrast, not decoration.
The Typography Rule 2026 Standard
Tables are often viewed on mobile devices in hybrid meetings. Legible fonts are not a rule—it is a risk.
Headers: Must be 44–64 pt to act as a visual anchor.
Cell Data: Must be 24–32 pt for true readability.
The Mobile Test: If you cannot read the table on a 6-inch phone screen without zooming, reject the template.
No Thin Fonts: Avoid thin or decorative fonts—they break on projectors and high-resolution screens.
Pay attention to spacing and alignment.
Good spacing makes data more understandable.
- A good table template should:
- Align the text neatly in each cell.
- Provide sufficient padding around text.
Keep headers well distinguished from data. Even small improvements in spacing can make a big difference when it comes to the speed at which people understand the table.
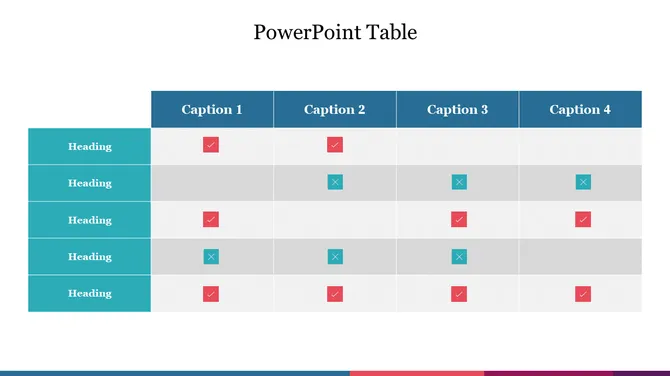
Make sure headers are clear
Headers act as a map for the audience. In other words, they are the key to understanding the content of each column.
Pick templates that:
- Provide enough space for headers.
- Maintain different appearances among headers.
- Keep long labels from being reduced into narrow columns.
- Clear headers help to avoid confusion and reduce the need for verbal explanations.
Match the Table Style With Presentation
A tone is present in every presentation. The tone of your table template should be the same.
For example:
- Calm and neutral tables are necessary for business reviews
- Clear and structured tables are the requirements for academic presentations
- Friendly but clean designs are the source of team updates
Ensure consistency throughout slides.
If your presentation has multiple table elements, uniformity is a requirement.
A good table template should:
- Transfer well from slide to slide.
- Use the same font and spacing style
- Maintain alignment consistency
Consistency allows viewers to concentrate on the data rather than adjusting to a new layout.
Check Editing Flexibility
A template should facilitate editing.
Before picking one, you need to:
Can you add or remove rows easily?
Can column widths be adjusted?
Can colors be changed if needed?
A customisable table PPT can help you save time and reduce last-minute editing difficulties.
Consider Screen Size and Viewing Distance
Presentations in the year 2026 are displayed on a variety of devices.
Your table layout must:
- Be clear on big monitors
- Be readable on notebooks
- Avoid using small writing or thin columns.
If possible, view the template in full-screen mode. You think it’s clear from a distance, it’s a good choice.
Why Choosing the Right Table Template Matters
The year 2026 will be the time when trust is built with clarity. Easy-to-understand data gives users confidence in their decisions. A well-chosen table template promotes effective communication while also saving time in meetings.
Using the right PowerPoint table template helps your message stand out without distraction. It allows the data to speak for itself.
Conclusion
Selecting the proper table presentation template involves purpose, clarity, and the speed of readability. Begin with understanding the data. Look for neat designs. Consider the use of spaces, the size of the fonts, or the flexibility of the presentation.
An excellent table template can be designed to impress. A good template can help you see clearly.
Download the clear table PPT templates, choose the one that best fits your data, and let it work its magic!
Credit: https://www.slideegg.com/powerpoint-table
FAQ
1. Why should I use a table rather than a chart?
Use a table when you want to display exact values and detailed comparisons clearly. Tables are best for structured data, such as pricing, reports, and specifications, where accuracy is important.
2. How many rows should each table slide have?
Don’t count rows; count seconds. Use the 8-Second Strategy. If the audience cannot identify the important trend, in 8 seconds, you have too much information. Divide it into multiple slides.
3. What makes a professionally designed table template in 2026?
A professional table template emphasises the importance of insight. It has Deep Charcoal backgrounds, exact 24-point plus font, and Semantic Heatmapping.
4. Can I use the same table template in multiple presentations?
Yes, you can reuse the same table template across multiple presentations. It ensures consistency, saves time, and maintains a professional look every time.
5. How can I evaluate whether a table template is clear and adequate?
You can evaluate a table template by checking if the data is easy to read at a glance.
Clear alignment, proper spacing, and visible headers indicate an effective and adequate table design.