
| Step-by-Step Way to Insert Google Sheets into Google Slides ✅ Open your Google Slides presentation. ✅ Click the slide where you want the Sheet to appear. ✅ Go to Insert > Chart > From Sheets. ✅ Choose your Google Sheet file. ✅ Pick the chart or table you want to insert. ✅ Click Import. ✅ To link live data, make sure the “Link to spreadsheet” box is checked. ✅ Done! Now it updates when the Sheet updates. |
Introduction
Adding a Google Sheet to a Google Slide is one of the easiest ways to keep your data clear and updated during a presentation.
Instead of copying and pasting numbers or charts every time something changes, you can link your Google Sheet directly into your slide. This saves time, avoids mistakes, and makes your work look more polished.
In this guide, we’ll walk you through how to add a Google Sheet to a Google Slide step-by-step. No complex tools, no confusing tech. Just a clean, easy way to keep your data looking sharp.
Why Add Google Sheets to Google Slides?
Before we start, let’s see why this helps:
- You can share live data—no need to copy-paste every time something changes.
- It looks neat and saves time.
- You can create reports that update on their own.
- Helps you stay organized.
Pretty useful, right? Let’s move on to how it’s done.
Step 1: Open Google Slides and Choose a Slide
First, open the Google Slides file where you want to add the chart or table. Click the exact slide where you want to place the data.
Tip: Keep your Slides and Sheets in the same Google account. That way, you won’t face access issues.
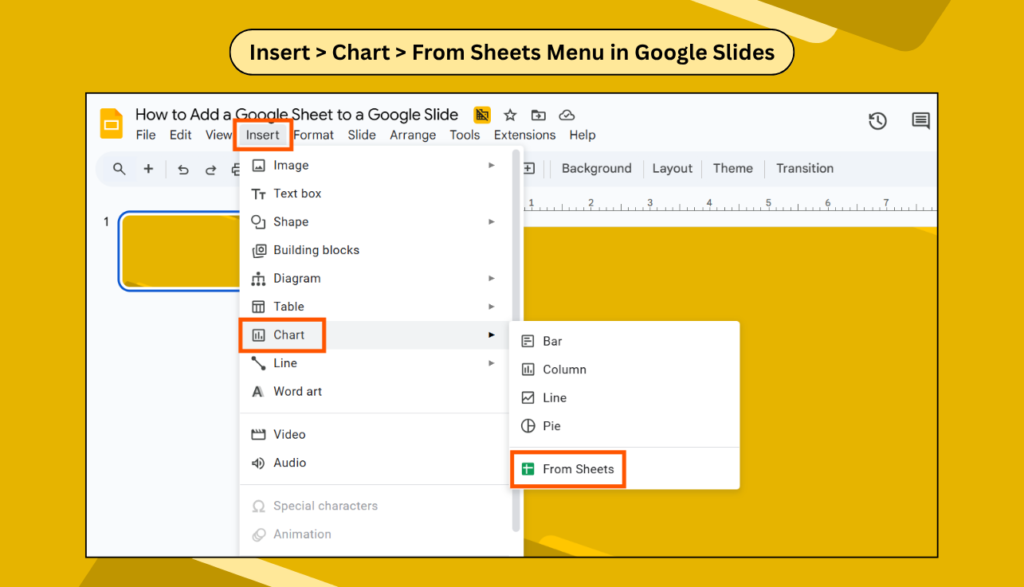
Step 2: Click Insert > Chart > From Sheets
- Now go to the top menu and click Insert.
- Then hover over Chart, and you’ll see options. Choose From Sheets.
- This means you are pulling a chart directly from a Google Sheet.
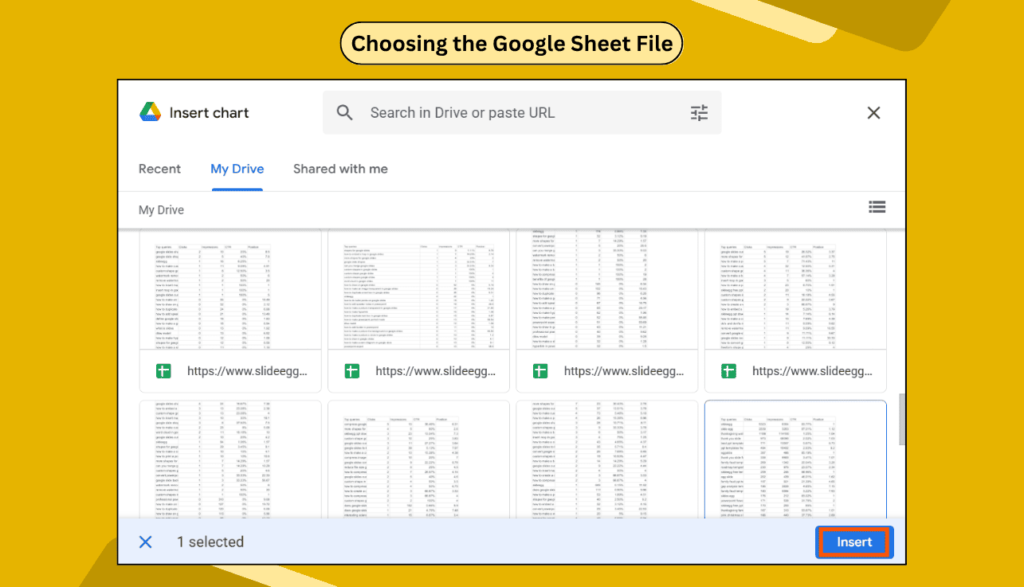
Step 3: Choose the Google Sheet File
- After clicking “From Sheets,” a popup will appear with your Google Drive files. Pick the one you want.
- Click on it and press Insert.
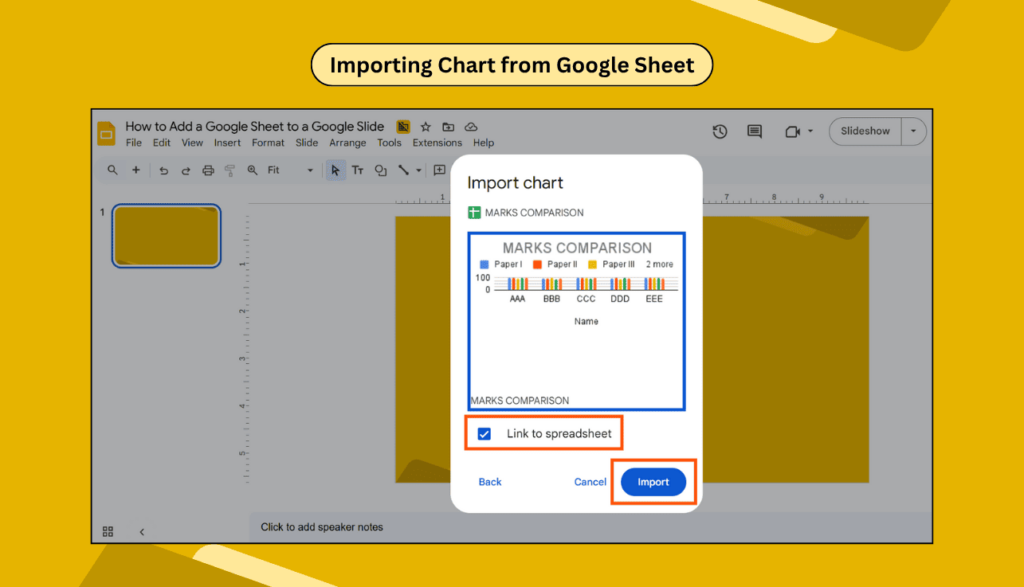
Step 4: Pick the Chart or Table You Want
- If your Sheet has more than one chart or table, you’ll see them listed.
- Choose the one you need.
- Make sure “Link to spreadsheet” is checked. This way, if the chart updates in Sheets, it will also update in Slides.
- Click Import.
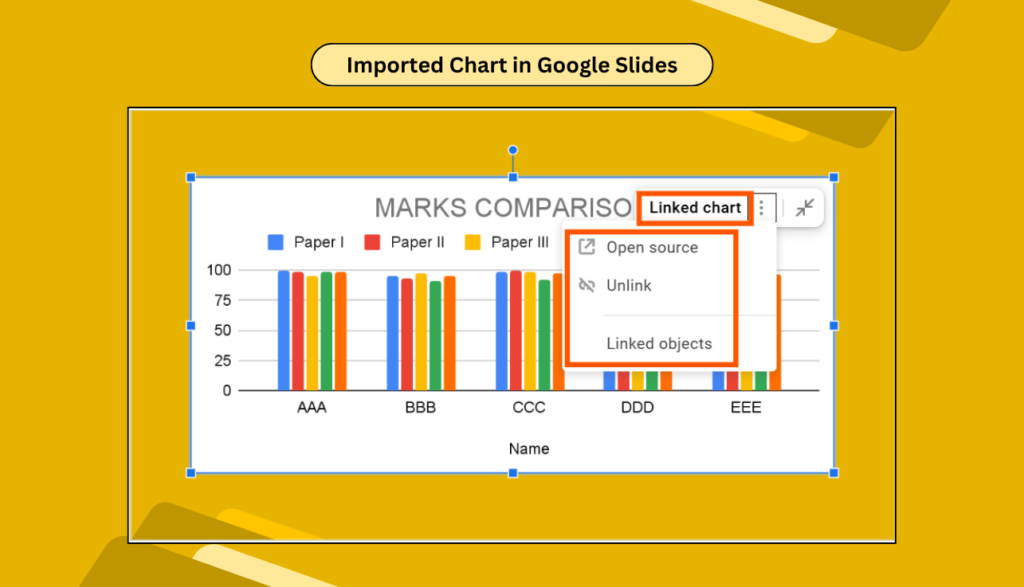
Step 5: Adjust Size and Position
- Now the chart appears on your slide. You can move it, resize it, or even add a border if you like.
- It behaves like an image, but it’s smart—it knows where it came from.
Bonus Tip: Want to Add a Table Instead of a Chart?
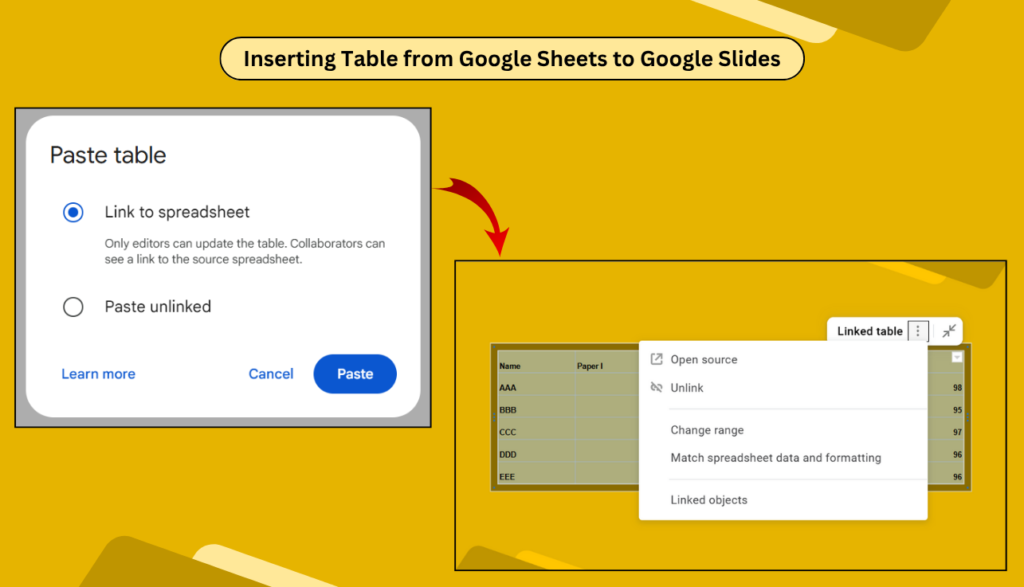
If you want to insert a table from Google Sheets (not just a chart), follow these extra steps:
- Go to your Sheet.
- Select the cells you want.
- Copy them (Ctrl + C or Cmd + C).
- Go back to Slides.
- Paste (Ctrl + V or Cmd + V).
A small popup will ask if you want to link to a spreadsheet—click Link.
Now your table is inside your slide and will update when the Sheet updates.
What Happens When Data in Sheets Changes?
- If your data or chart changes in the Sheet, you’ll see a small “Update” button in Slides.
- Click that and boom—it refreshes with the new data. No need to insert it again.
Simple Things to Keep in Mind
- If the chart doesn’t update, check if you’re signed in to the correct Google account.
- Charts update only if they are linked to the Sheet.
- You can unlink anytime if you want a static version.
Real-Life Uses
Here’s how people use this in real life:
- Teachers showing exam results with graphs
- Startups presenting monthly sales growth
- NGOs sharing donation data
- Students using it in science fair presentations
FAQs – Google Sheets and Slides
Q: Can I edit the chart after adding it to Slides?
A: You can resize or move it in Slides. But to change data or chart style, go back to the Sheet.
Q: Will it update if I share the Slides with someone else?
A: Yes, if they have access to both the Slide and the Sheet. Otherwise, they’ll see a snapshot.
Q: Can I insert multiple charts from one Sheet?
A: Yes! Just repeat the steps for each chart.
Q: Can I insert a table that looks like a chart?
A: You can use conditional formatting in Sheets and copy-paste the table. It’ll look colorful and smart.
Q: What happens if I delete the chart in the Sheet?
A: The one in Slides stays, but it won’t update anymore.
Wrap Up
Adding a Google Sheet to a Google Slide is one of those little things that can make your work look clean, updated, and smart. It saves time, reduces mistakes, and helps you focus more on your message—not manual edits.
So the next time you need to present numbers, don’t stress. Just link the Sheet, click update when needed, and you’re good to go. Let your data do the talking, while you focus on the story behind the numbers.