Engineering Infographics PowerPoint And Google Slides

 Canva
Canva
Engineering Infographics PPT, Google Slides, And Canva Template
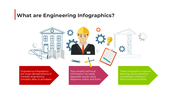
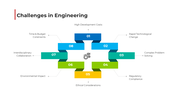
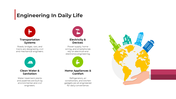
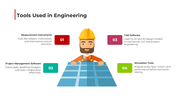
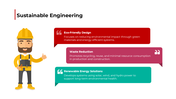
The term “engineering infographics” refers to visual content formats that help explain STEM-related information. These visuals can include process diagrams, schematics, and workflow representations. Our platform uses well-organized infographics to explain engineering topics. They help bridge the gap between theoretical data and practical understanding, especially in professional, educational, or industrial settings.
Purpose Of The Slides
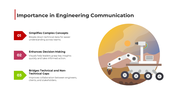
This infographic slide platform is built to enhance presentations with data-driven graphics, flowcharts, and timeline views. It’s perfect for engineering project reports, classroom learning, and industrial presentations. With editable elements and technical illustrations, each slide is designed to support accurate communication of engineering processes, specifications, or system functions.
Who Can Use It?
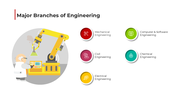
Designed for engineers, educators, students, researchers, and technical consultants. Whether you’re presenting a thesis presentation, hosting a technical workshop, or sharing design workflows, this template provides flexibility and clarity. It’s ideal for mechanical, civil, electrical, or software engineering topics that benefit from streamlined, visual-first communication.
Special Key Features
Includes 20 editable infographic slides with diagrams, previews, project views, and clean layouts. Compatible with Google Slides, PowerPoint, and Canva. Download now to present your engineering insights with visual impact using this clean, modern, and customizable engineering infographics platform.
Features of this template
- 100% customizable slides and easy to download.
- The slides contain 16:9 and 4:3 formats.
- Easy to change the colors quickly.
- Highly compatible with PowerPoint, Google Slides, and Canva templates.

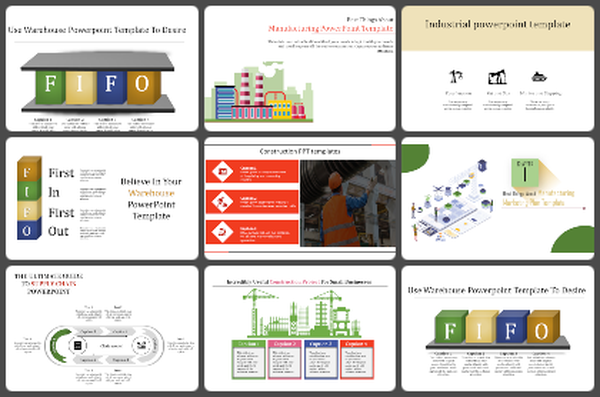
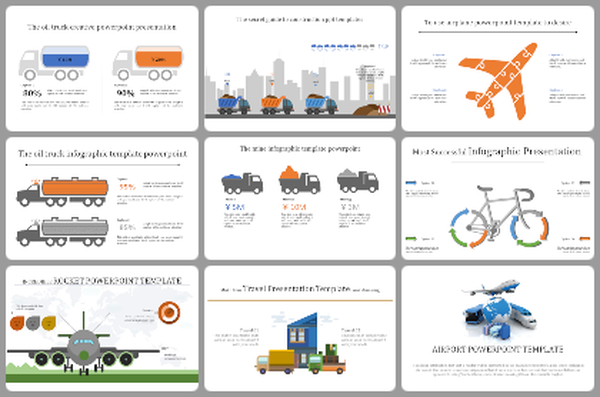
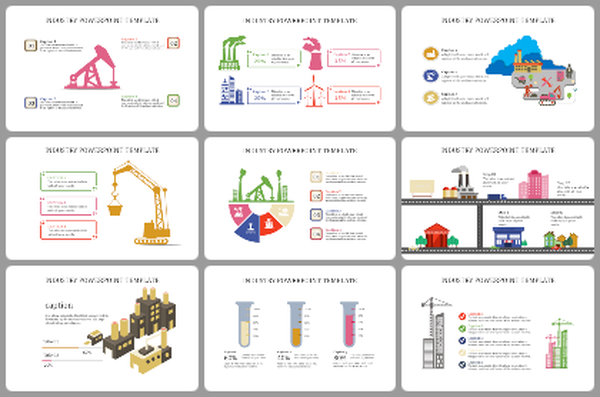
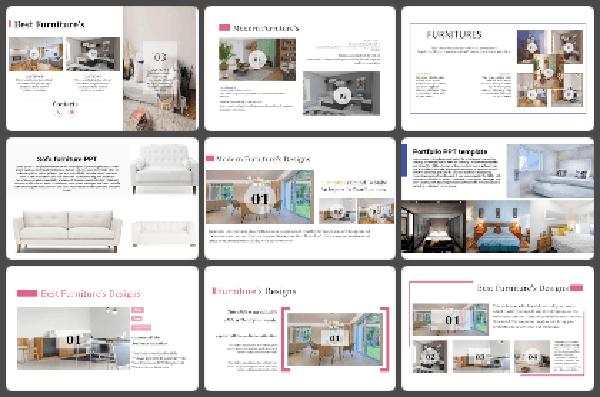

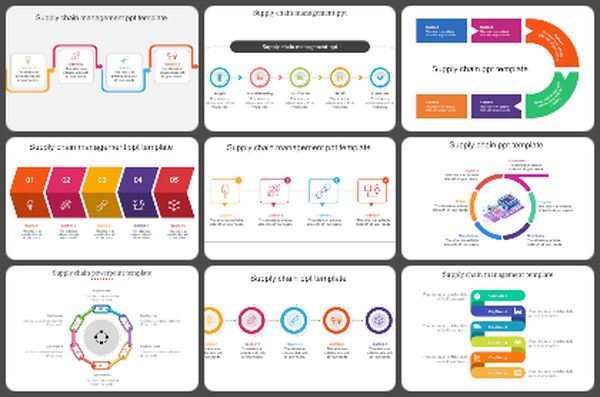
You May Also Like These PowerPoint Templates
Add to Wishlist
Download
Edit

Add to Wishlist
Download
Edit

Add to Wishlist
Download
Edit


Add to Wishlist
Download
Edit


Add to Wishlist
Download
Edit

Add to Wishlist
Download
Edit

Add to Wishlist
Download
Edit

Add to Wishlist
Download
Edit

Add to Wishlist
Download
Edit

Add to Wishlist
Download
Edit

Add to Wishlist
Download
Edit

Add to Wishlist
Download
Edit

Add to Wishlist
Download
Edit

Add to Wishlist
Download
Edit

Add to Wishlist
Download
Edit


Add to Wishlist
Download
Edit

Add to Wishlist
Download
Edit
