Business Finance Power Point With Bulb Model Presentation

 Canva
Canva

Business Finance PowerPoint and Google Slides
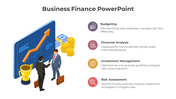
The "Business Finance PowerPoint and Google Slides" template offers a comprehensive visual tool for illustrating financial concepts and strategies. The image within the template features a bar graph, where the left blue bar represents "Caption A" and the right green bar represents "Caption B." The y-axis denotes "$M" (million dollars), while the x-axis signifies different captions or categories related to business finance. The blue bar extends to the 2 mark on the y-axis, and the green bar extends to the 5 mark, highlighting varying financial values.
This template is ideal for businesses, financial institutions, educators, and professionals seeking to present or teach financial concepts effectively. Whether showcasing financial performance, analyzing investment opportunities, or discussing business strategies, this template provides a visually engaging and informative tool.
Compatible with PowerPoint and Google Slides. Available in 16:9, 4:3, and zip formats. Free to use. Fully customizable for personalized presentations, Download now!

You May Also Like These PowerPoint Templates
Add to Wishlist
Download
Edit

Add to Wishlist
Download
Edit

Add to Wishlist
Download
Edit

Add to Wishlist
Download
Edit

Add to Wishlist
Download
Edit

Add to Wishlist
Download
Edit

Add to Wishlist
Download
Edit

Add to Wishlist
Download
Edit

Add to Wishlist
Download
Edit


Add to Wishlist
Download
Edit

Add to Wishlist
Download
Edit

Add to Wishlist
Download
Edit

Add to Wishlist
Download
Edit

Add to Wishlist
Download
Edit

Add to Wishlist
Download
Edit

Add to Wishlist
Download
Edit

Add to Wishlist
Download
Edit

Add to Wishlist
Download
Edit

Add to Wishlist
Download
Edit
